This section explain how a user can use the system. Explains how to monitor server,
webpages and API.
Also explains how to create public pages and incidents.
2. User Registration
A user have to login to Monitoring Zone to use the system.
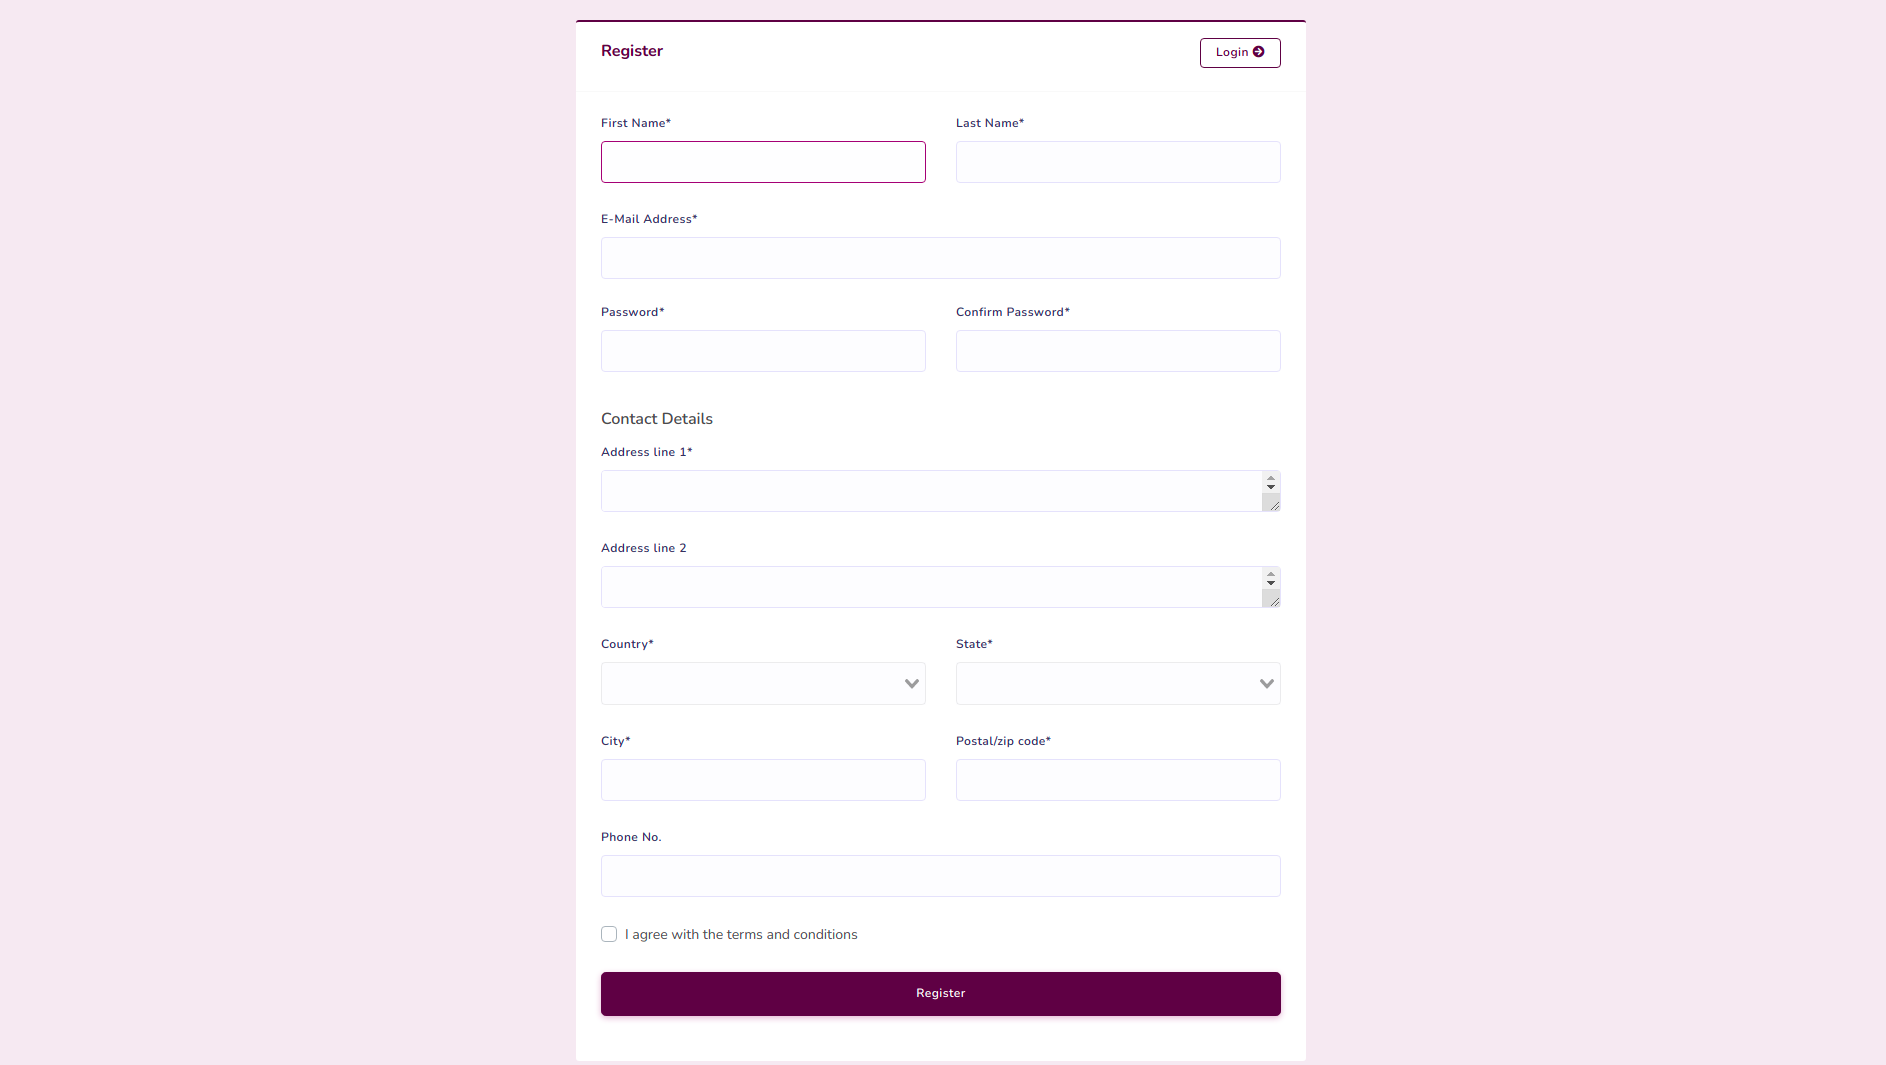
A new user should register with Monitoring Zone with their Email, password and
contact details.
Go to register section on right top corner of the home page to register.
Click on the register button and fill the required fields on the displayed page.
Then press Register.
User registration:
Fig.2.1 User registration
After registration a verification Email will be sent to registered Email address.
User have to verify the Email by clicking on Verify Email Address button.
After the verification the page will be automatically redirected to the dashboard of
Monitoring Zone.
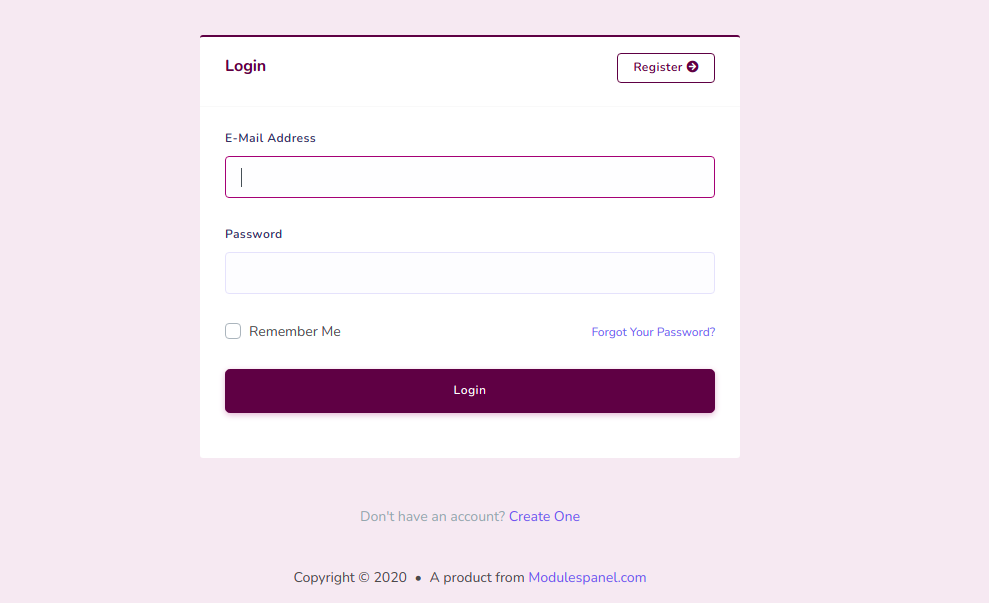
User can re-login to the system with this Email address and password from login
page.
User login:
Fig.2.2 User login
2.1 Reset Password
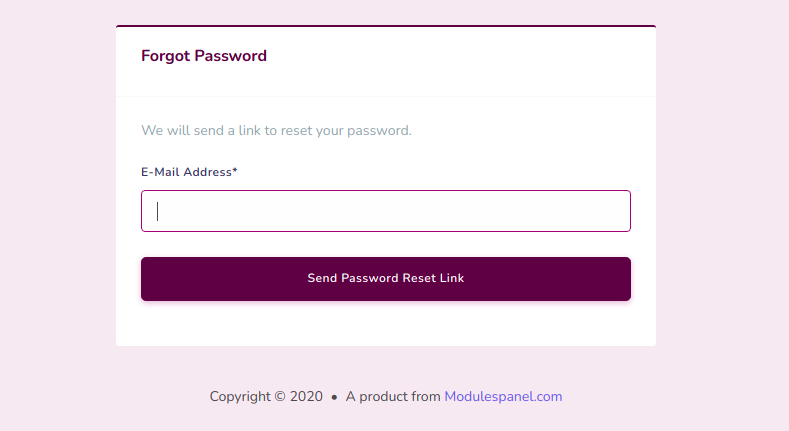
If anyone want to reset their password or have forgotten the password, they can use the
forgot password link below the login credentials.
After clicking on forgot password link user should provide their registered Email
address for the password reset link.
Password reset link:
Fig.2.3 Password reset link
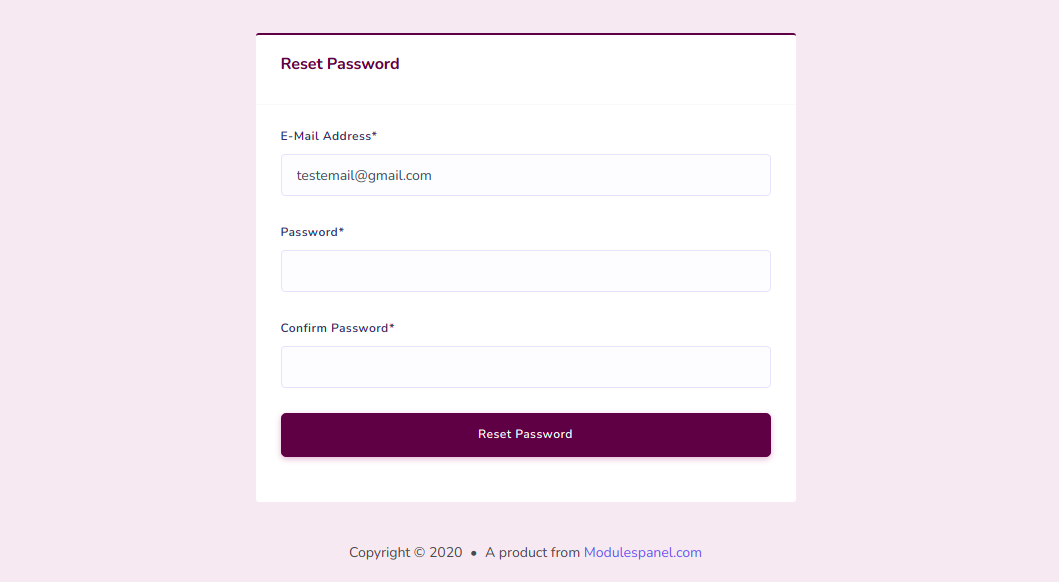
A password reset link will be sent to the registered email address of the user.
User have to open their Email and click on Password reset button.
A page with password reset fields will be opened and user can set their new password.
Reset password:
Fig.2.4 Reset password
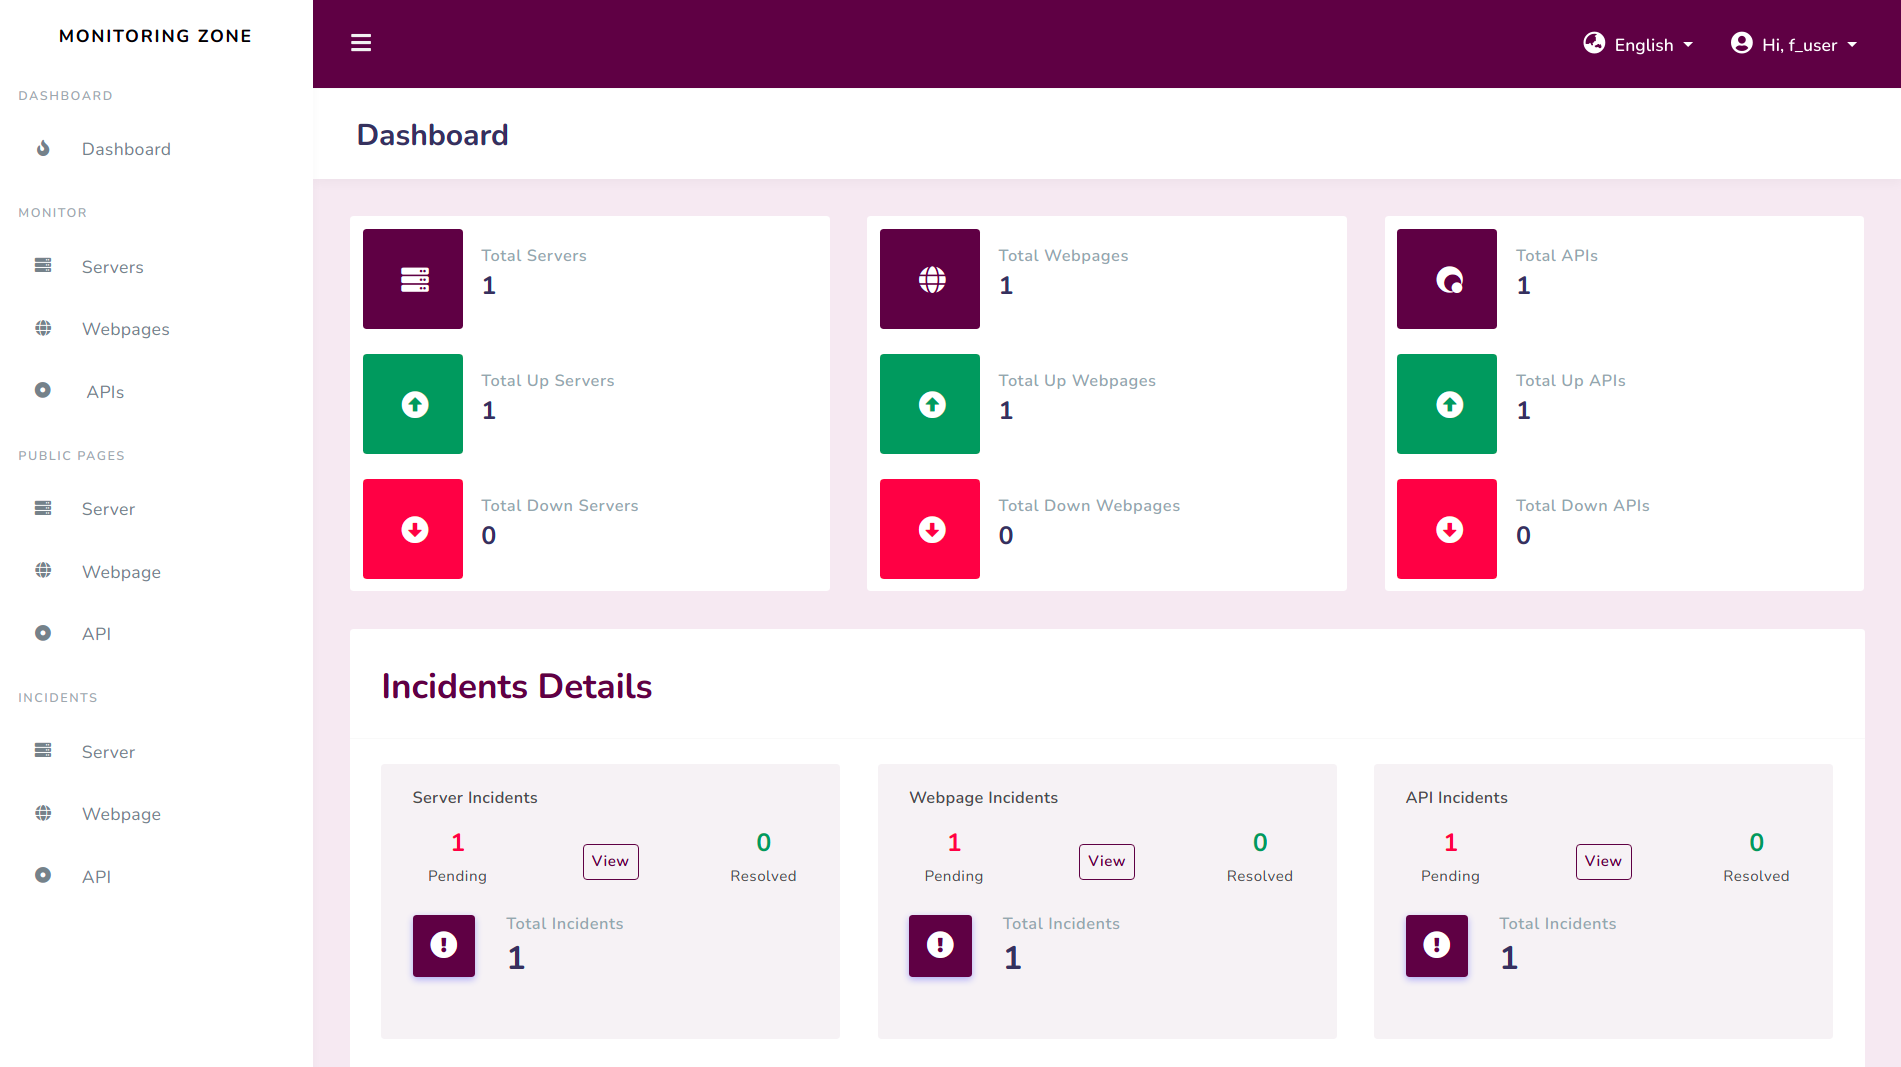
3. Dashboard
Dashboard view:
Fig.3.1 Dashboard
The user is provided with a dashboard which enables them to analyse monitoring details
and Incident details quickly.
3.1 Monitor Details
The user can easily check the monitoring details of Servers, Webpage and APIs.
They can also get the count of up and down status.
3.2 Incident Details
In incident details section, the user is provided with the total number of incidents
associated with Servers, Webpages and APIs along with the count of pending and resolved
incidents.
A link is also provided here where the user can quickly jump to the incidents page.
4. Server Monitor
One of the core features of Monitoring.Zone is server monitoring. This feature allows
user to get:
Up and Down status of the server.
Total up and down time percentage.
Avg.response time
Weekly status and all other features associated with the server.
Public page feature to analyse data for users, etc.
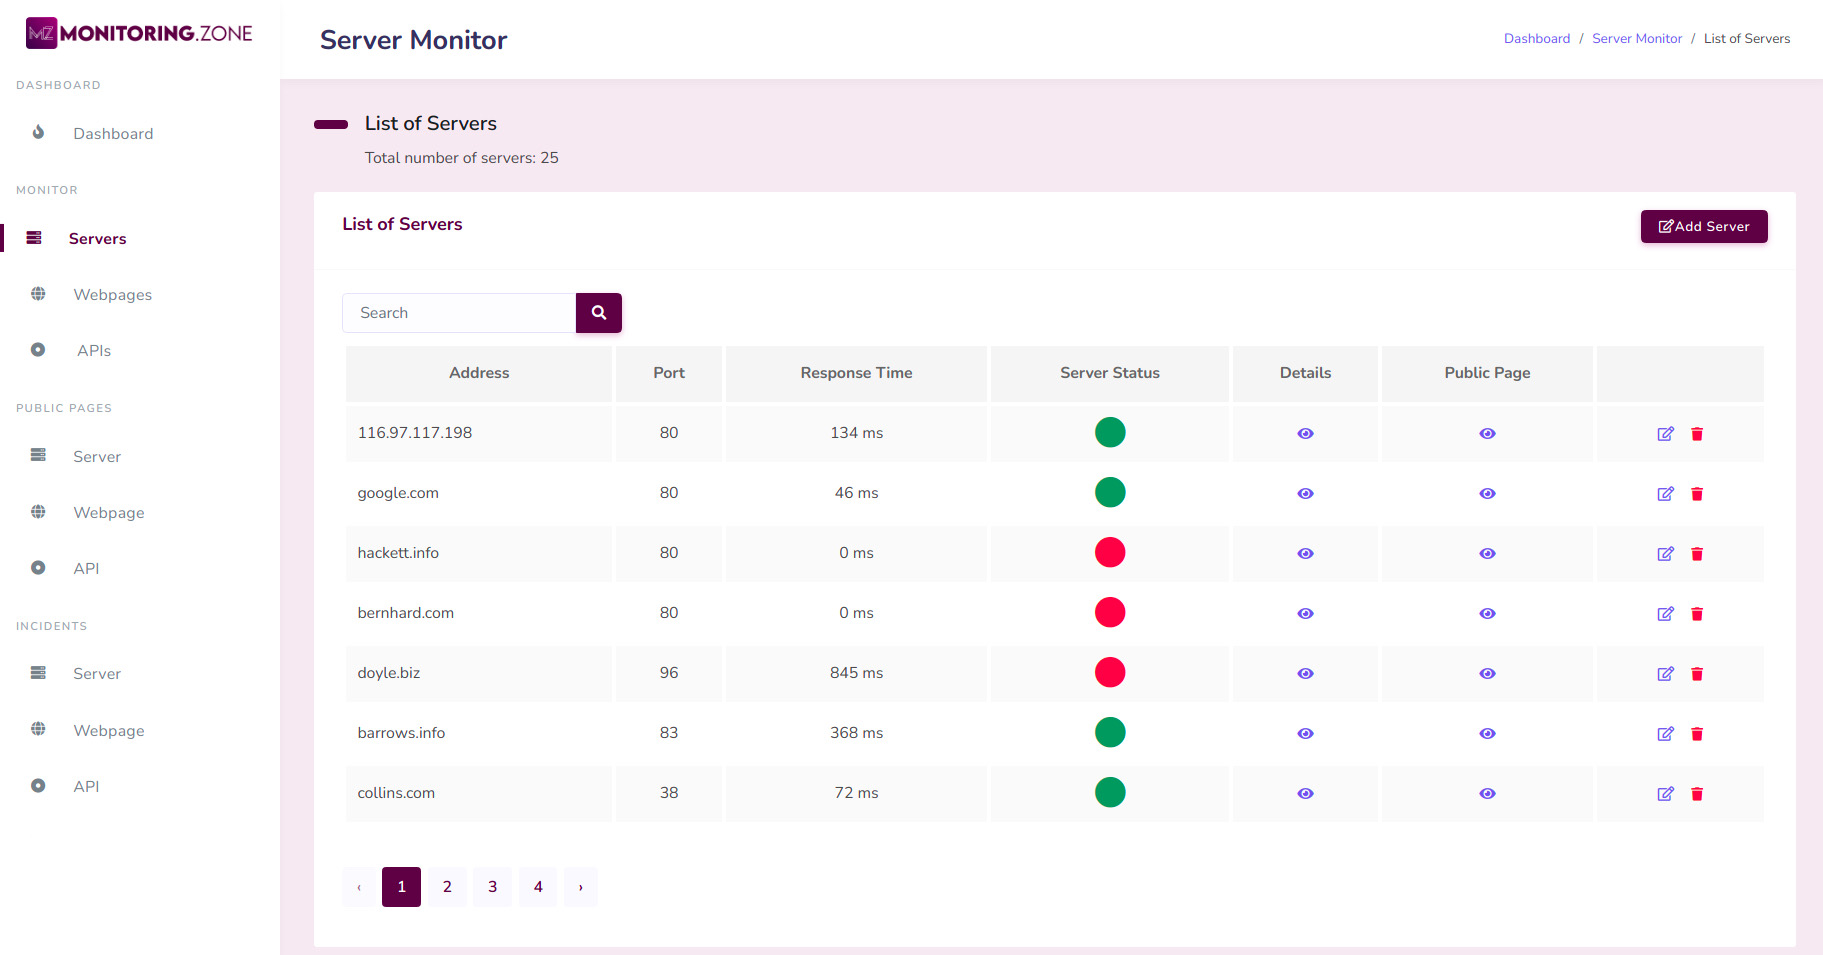
List of servers:
Fig.4.1 List of servers
The picture shown above is the listing of servers. The basic information like up and
down status, average response time and other details of the server is given here.
The green circle indicates that the server is up and the red circle indicates that the
server is down.
A user can access this page by clicking the "Servers" link on the monitor section.
There are some links also to add a server, view details of a server, view public page
of a server and updating and deleting of the server.
User can filter servers by searching with server address or related keywords.
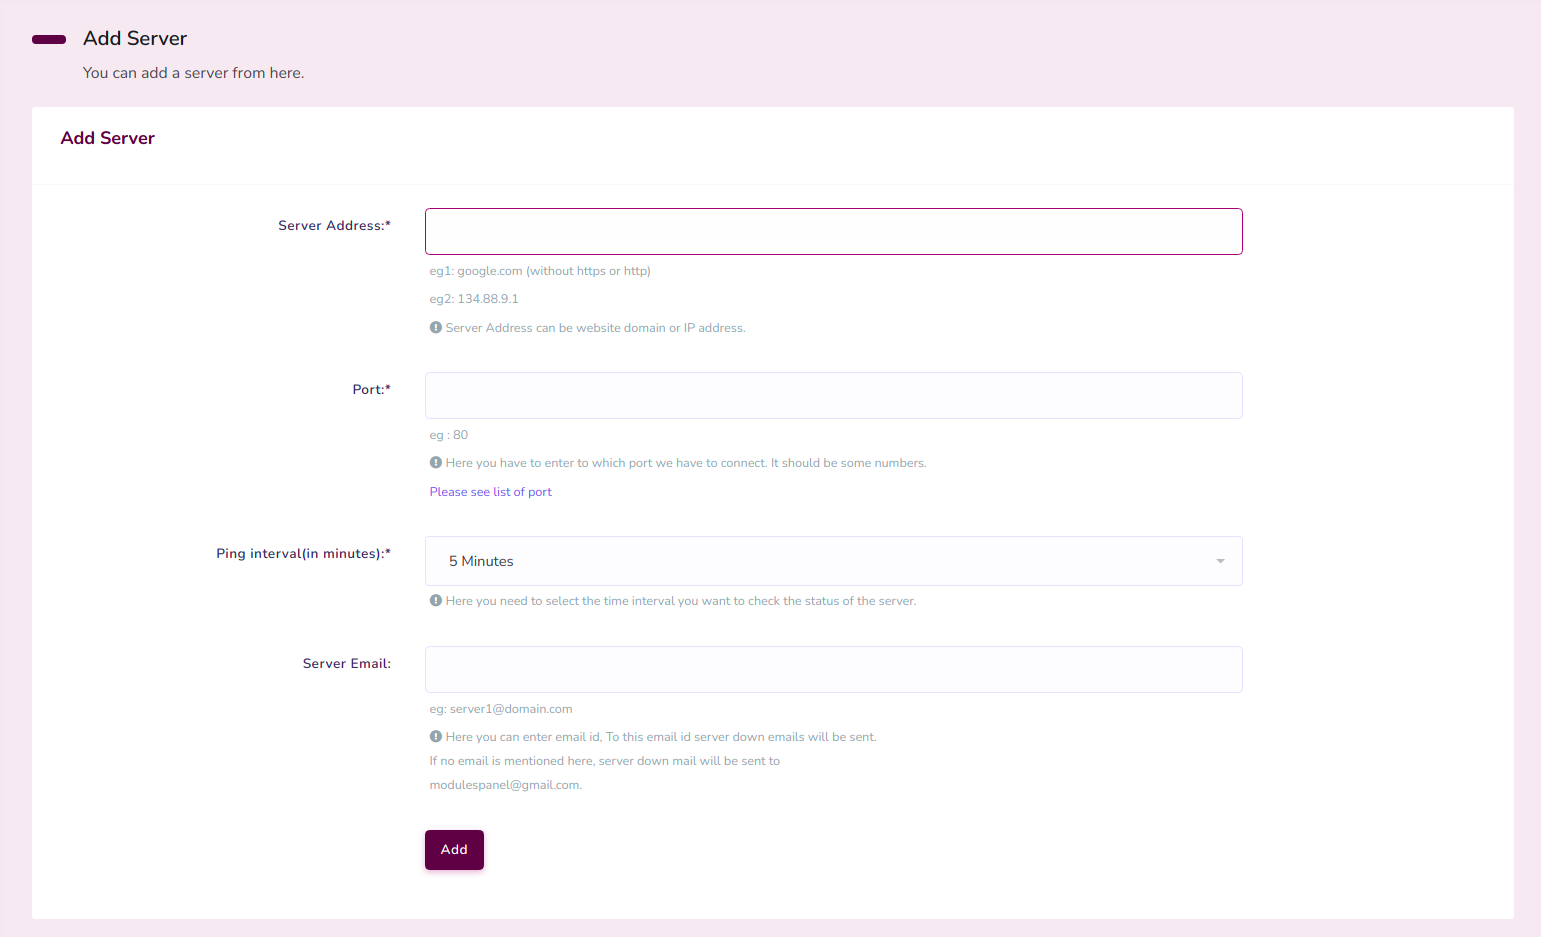
4.1 Add a Server
Add server page:
Fig.4.2 Add server page
User can add a server by clicking "Add Server" link given in the servers page.
User have to provide server address, port, ping interval (status check interval), and
server email (optional).
Server Address can be website domain or IP address.
User can provide an email address to receive the server status updates. If no email is
mentioned, the mail will be sent to the user's email address.
If the server is down at the time of adding (if the details given are incorrect or if
the server is actually down), a warning message will appear at the top. If you still
need to add, you can check the checkbox appeared at the bottom and click the add button
again.
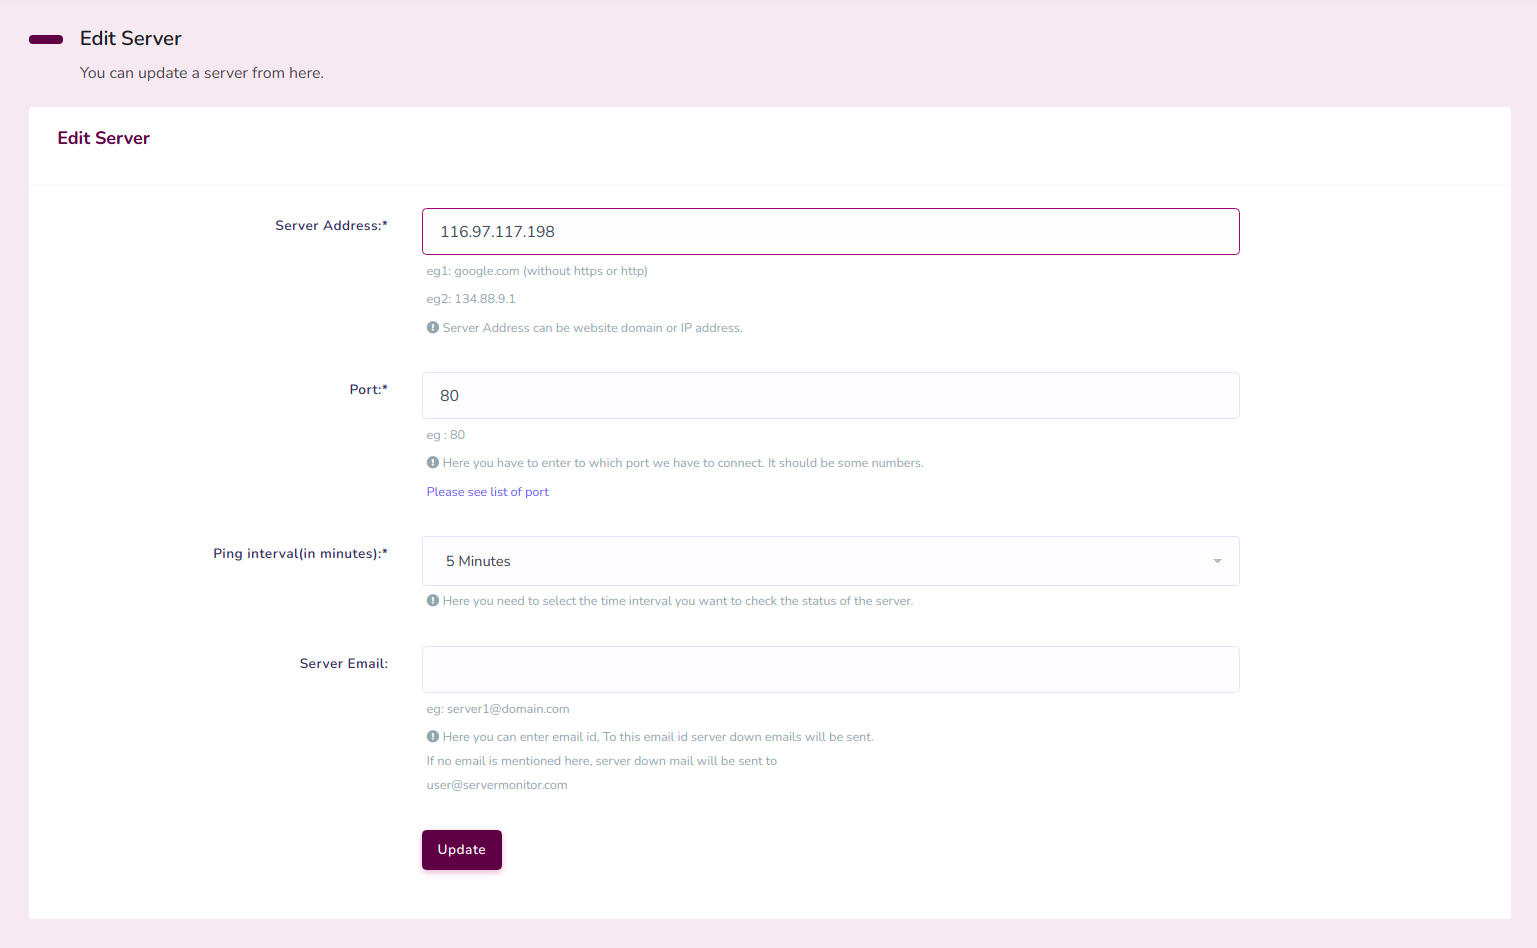
4.2 Update a Server
Update server page:
Fig.4.3 Update server page
User can update a server by clicking edit link given in the servers page.
User have to provide the updated details as done at the time of adding server.
As in the case of add server, if the server is down at the time of updating (if the
details given are incorrect or if the server is actually down), a warning message will
appear at the top. If you still need to update, you can check the checkbox appeared at
the bottom and click the update button again.
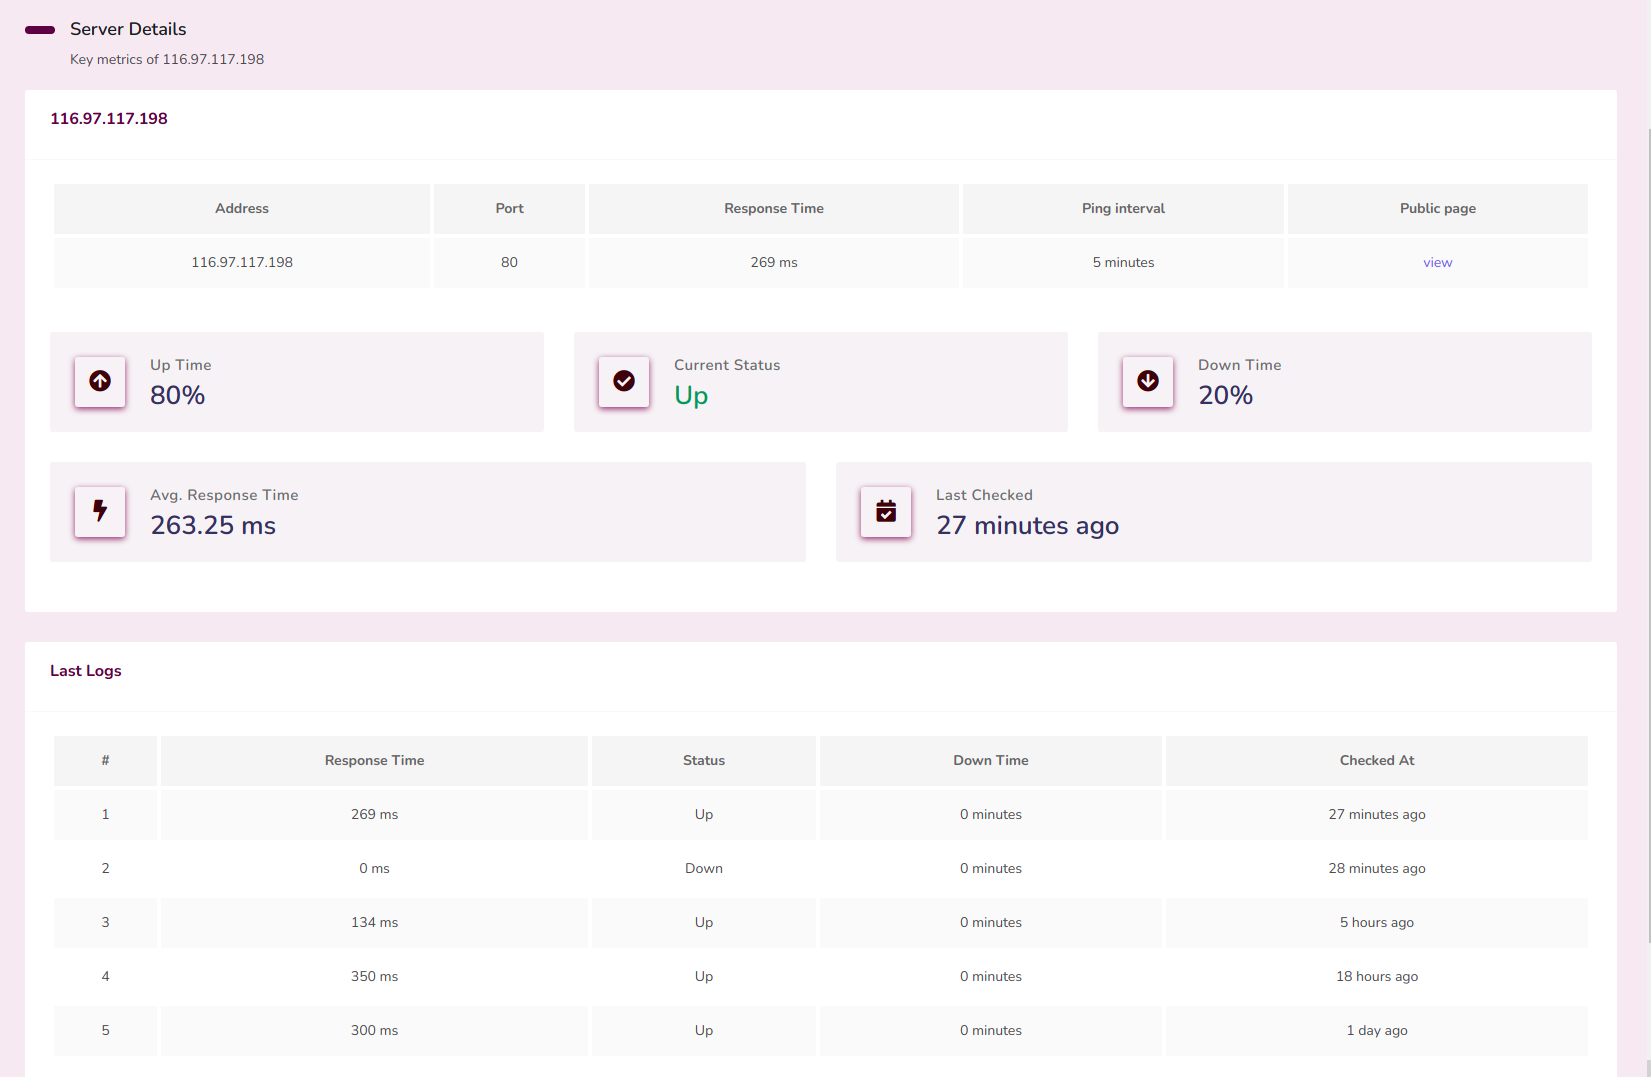
4.3 View a Server Details
Server details page:
Fig.4.4 Server details page
To get a server's detailed information, click on the view link from servers page.
User can get up time and down time percentage, current status, avg response time, last
checked time and last five logs of checking status from this page.
User can also access the public page from this page.
5. Webpage Monitor
As servers, user can also monitor webpages using this software. The user can get:
Up and Down status of the webpage.
Total up and down time percentage.
Avg.response time
Weekly status and all other features associated with the server.
Public page feature to analyse data for users, etc.
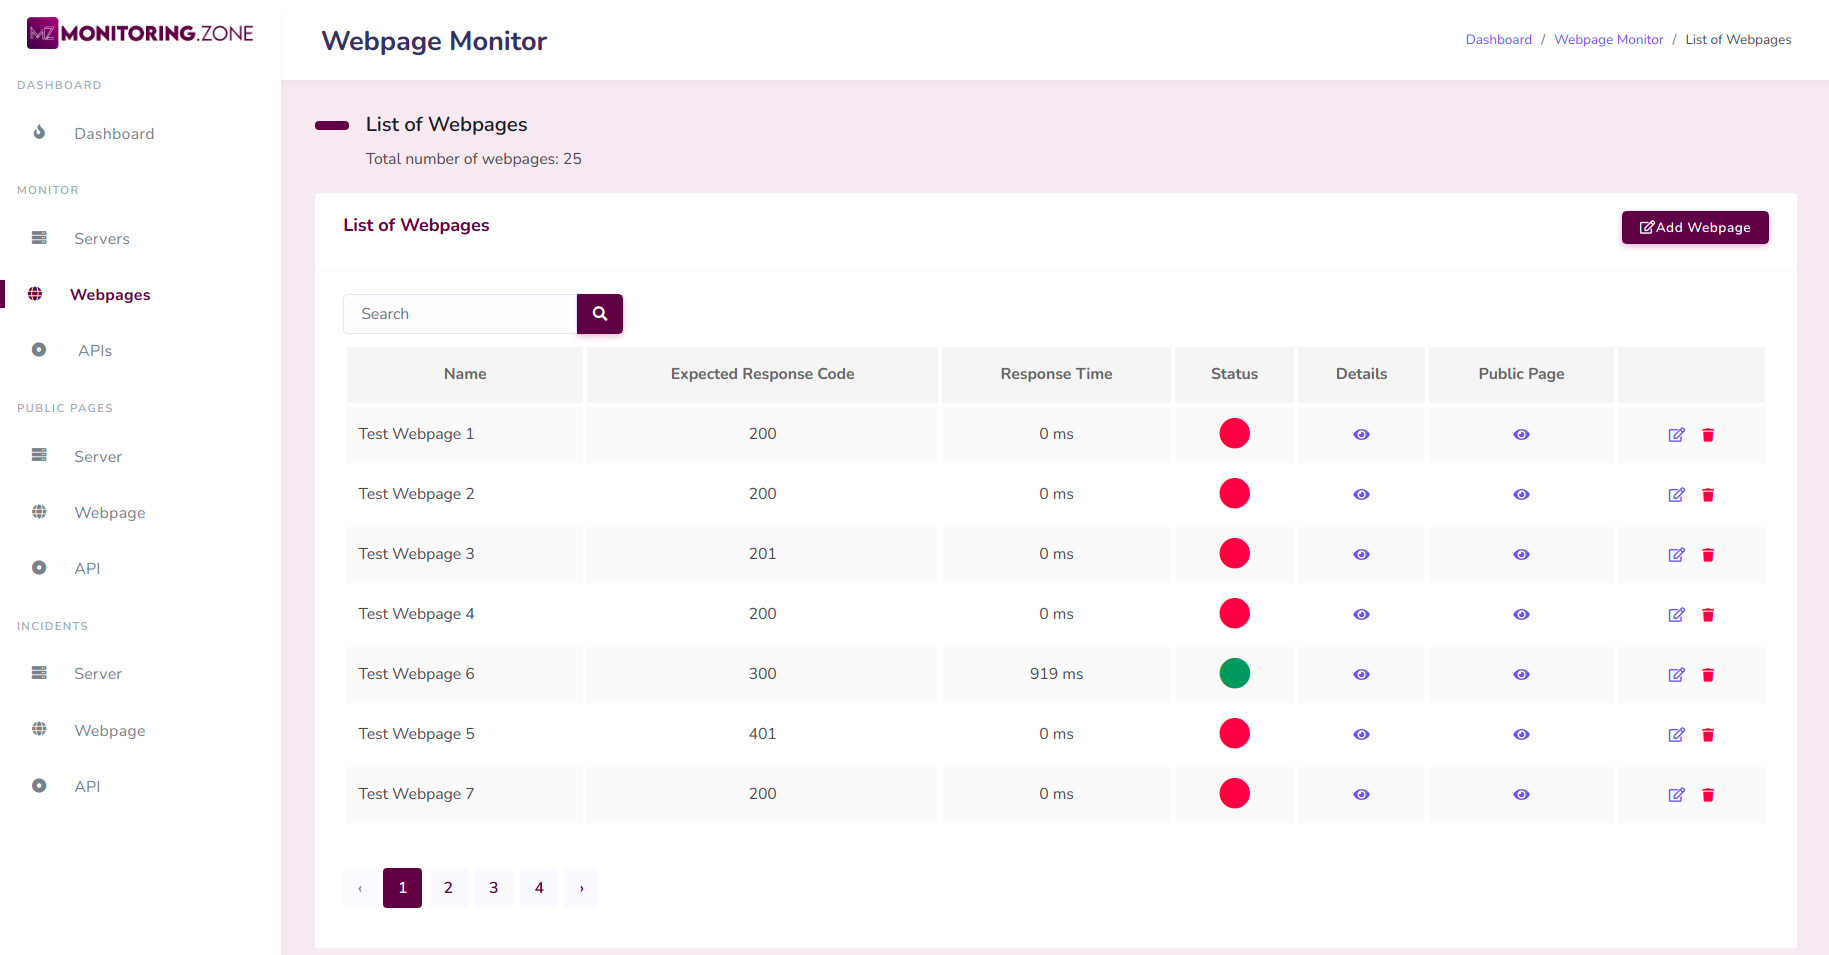
List of Webpages:
Fig.5.1 List of Webpages
The picture shown above is the listing of webpages. The basic information like up
and down status, average response time and other details of the webpage is given
here.
The green circle indicates that the webpage is up and the red circle indicates that
the webpage is down.
User can access this page by clicking "Webpages" link in monitor section.
There are some links in this page also to add a webpage, view details of a webpage,
view public page of a webpage, updating and deleting of the webpage.
User can filter webpages by searching with webpage name, URL and related keywords.
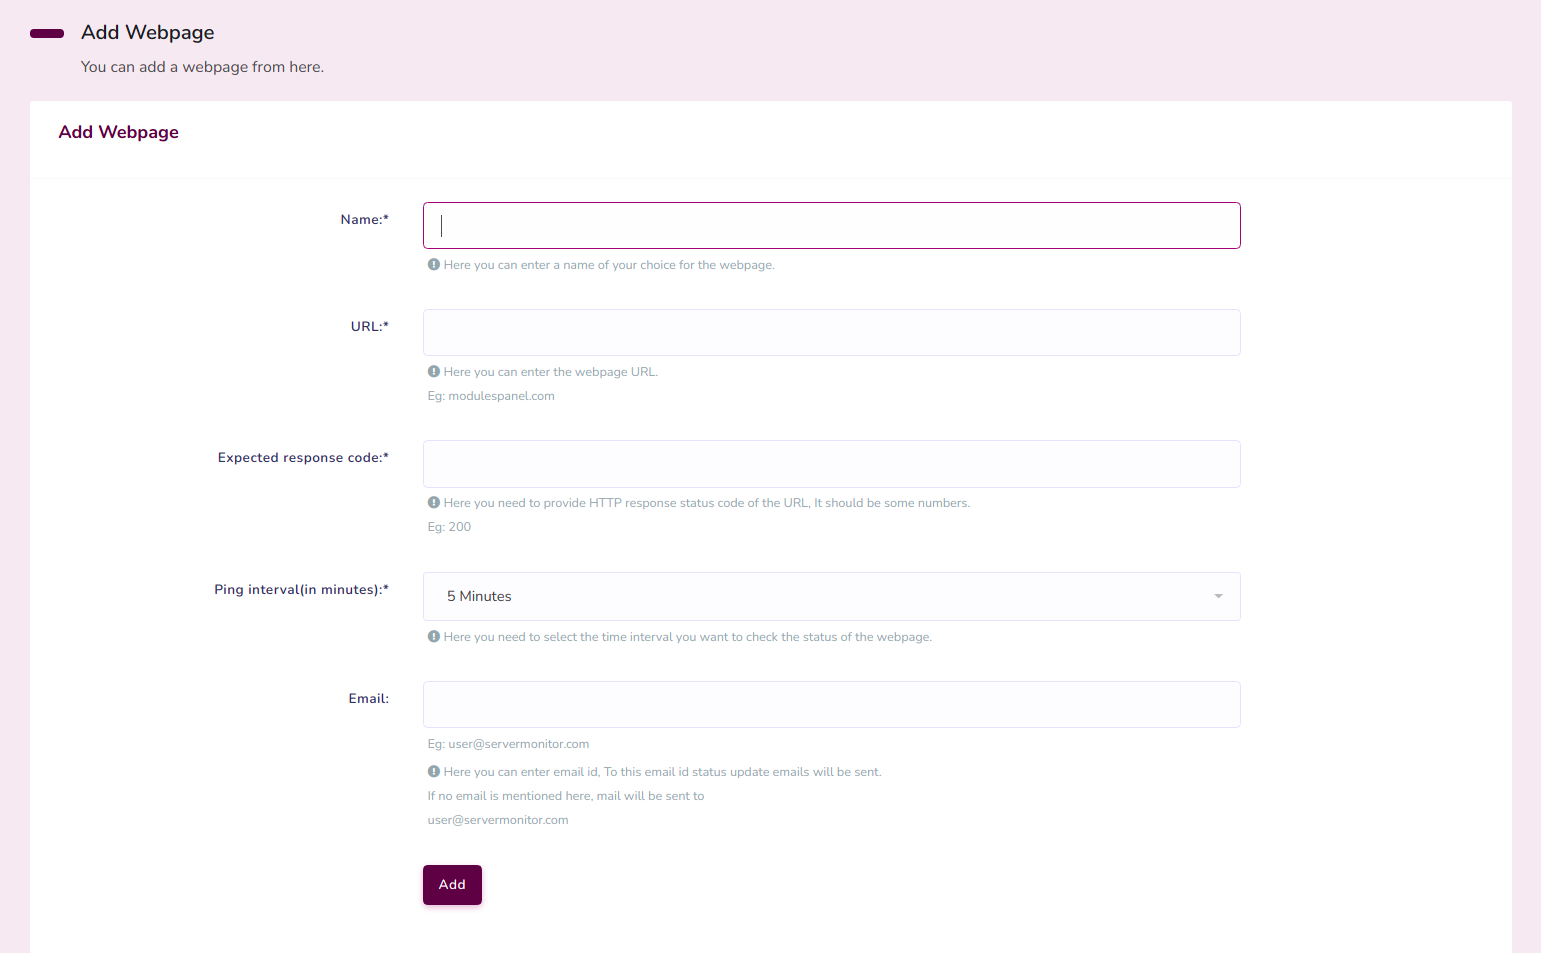
5.1 Add a Webpage
Add webpage panel:
Fig.5.2 Add webpage panel
User can add a webpage by clicking "Add Webpage" link given in the webpages page.
User have to provide a name for the webpage, URL of the webpage, Expected HTTP response
status code of the URL, ping interval(status check interval), and webpage
email(optional).
User can provide an email address to receive the webpage status updates. If no email is
mentioned, the mail will be sent to the user's email address.
If the webpage is down at the time of adding (if the details given are incorrect or if
the webpage is really down), a warning message will appear at the top. If you still need
to add, you can check the checkbox appeared at the bottom and click the add button
again.
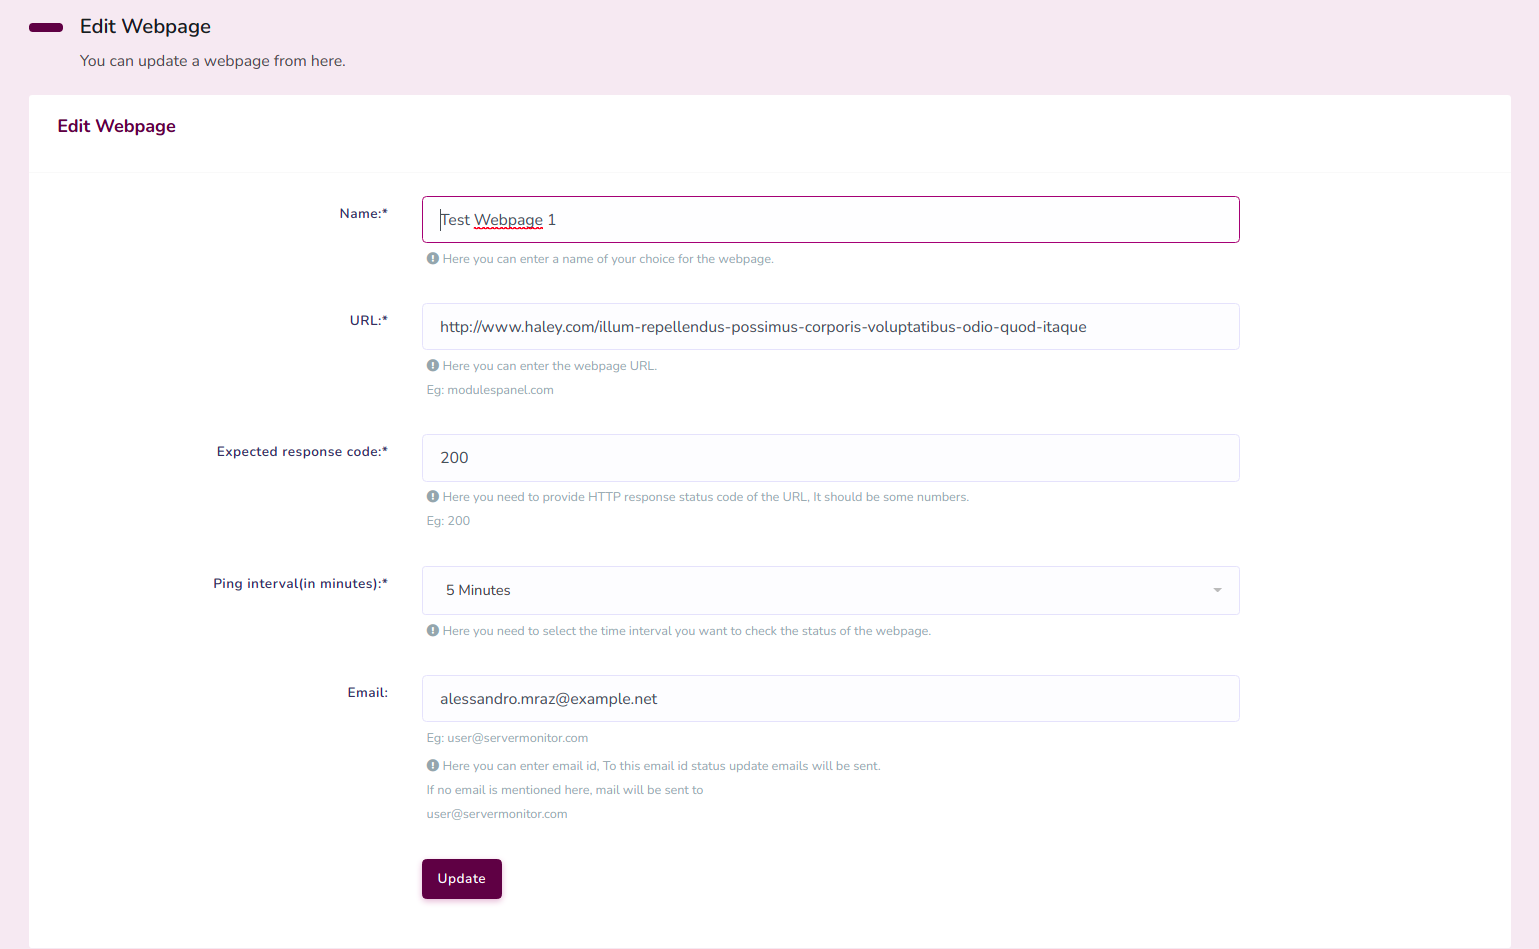
5.2 Update a Webpage
Update webpage panel:
Fig.5.3 Update webpage panel
User can update a webpage by clicking edit link given in the webpages page.
User have to provide the updated details as done at the time of adding webpage.
As in the case of add server, if the webpage is down at the time of updating (if the
details given are incorrect or if the webpage is really down), a warning message will
appear at the top. If you still need to update, you can check the checkbox appeared at
the bottom and click the update button again.
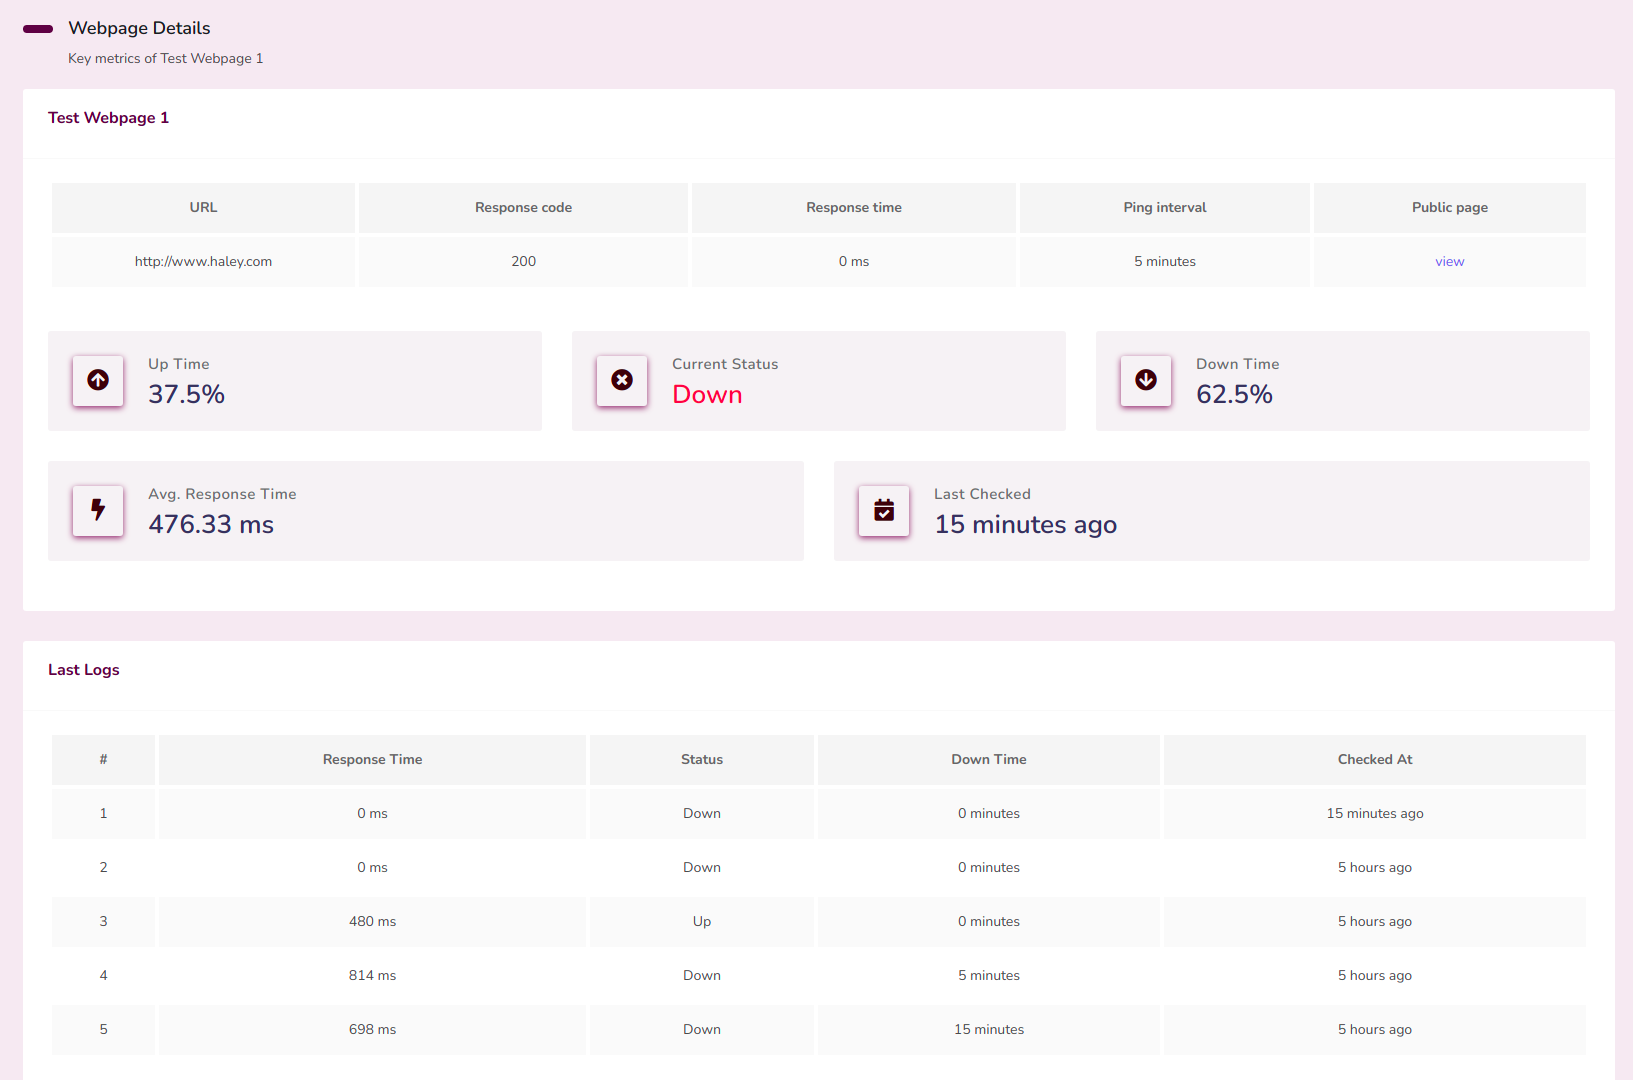
5.3 View Webpage Details
Webpage details page:
Fig.5.4 Webpage details page
To get a webpage's detailed information, click on the view link from webpages page.
User can get up time and down time percentage, current status, avg. response time, Last
checked time and last five logs of checking status from this page.
User can also access the public page from this page.
6. API Monitor
As servers and webpages, user can also monitor APIs using this software. The user can
get::
Up and Down status of the APIs.
Total up and down time percentage.
Avg.response time
Weekly status and all other features associated with the API.
Public page feature to analyse data for users, etc.
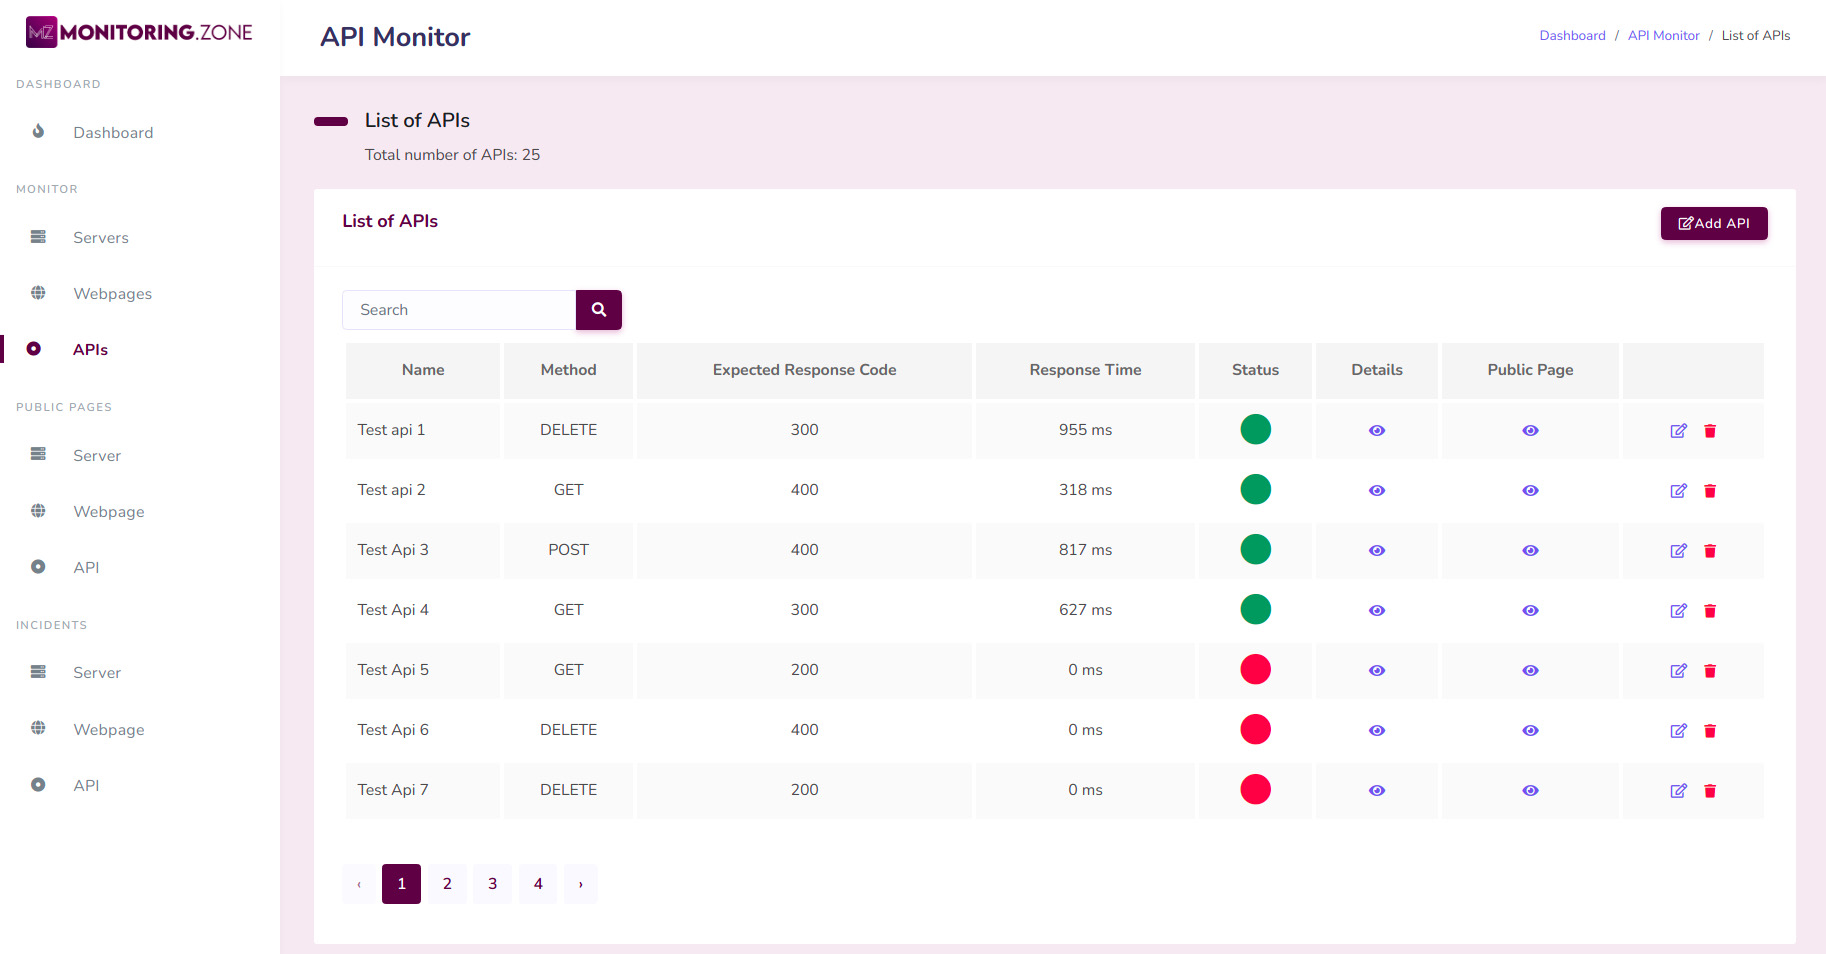
List of APIs:
Fig.6.1 List of APIs
The picture shown above is the listing of APIs. The basic
information
like up and down status, average response time and other details of the APIs is
given here.
The green circle indicates that the API is up and the red circle indicates that
the API is down.
User can access this page by clicking "APIs" link in monitor section.
There are some links in this page also to add an API, view details of an API, view
public
page of
an
API, updating and deleting of the API.
User can filter APIs by searching with API name, URL and related keywords.
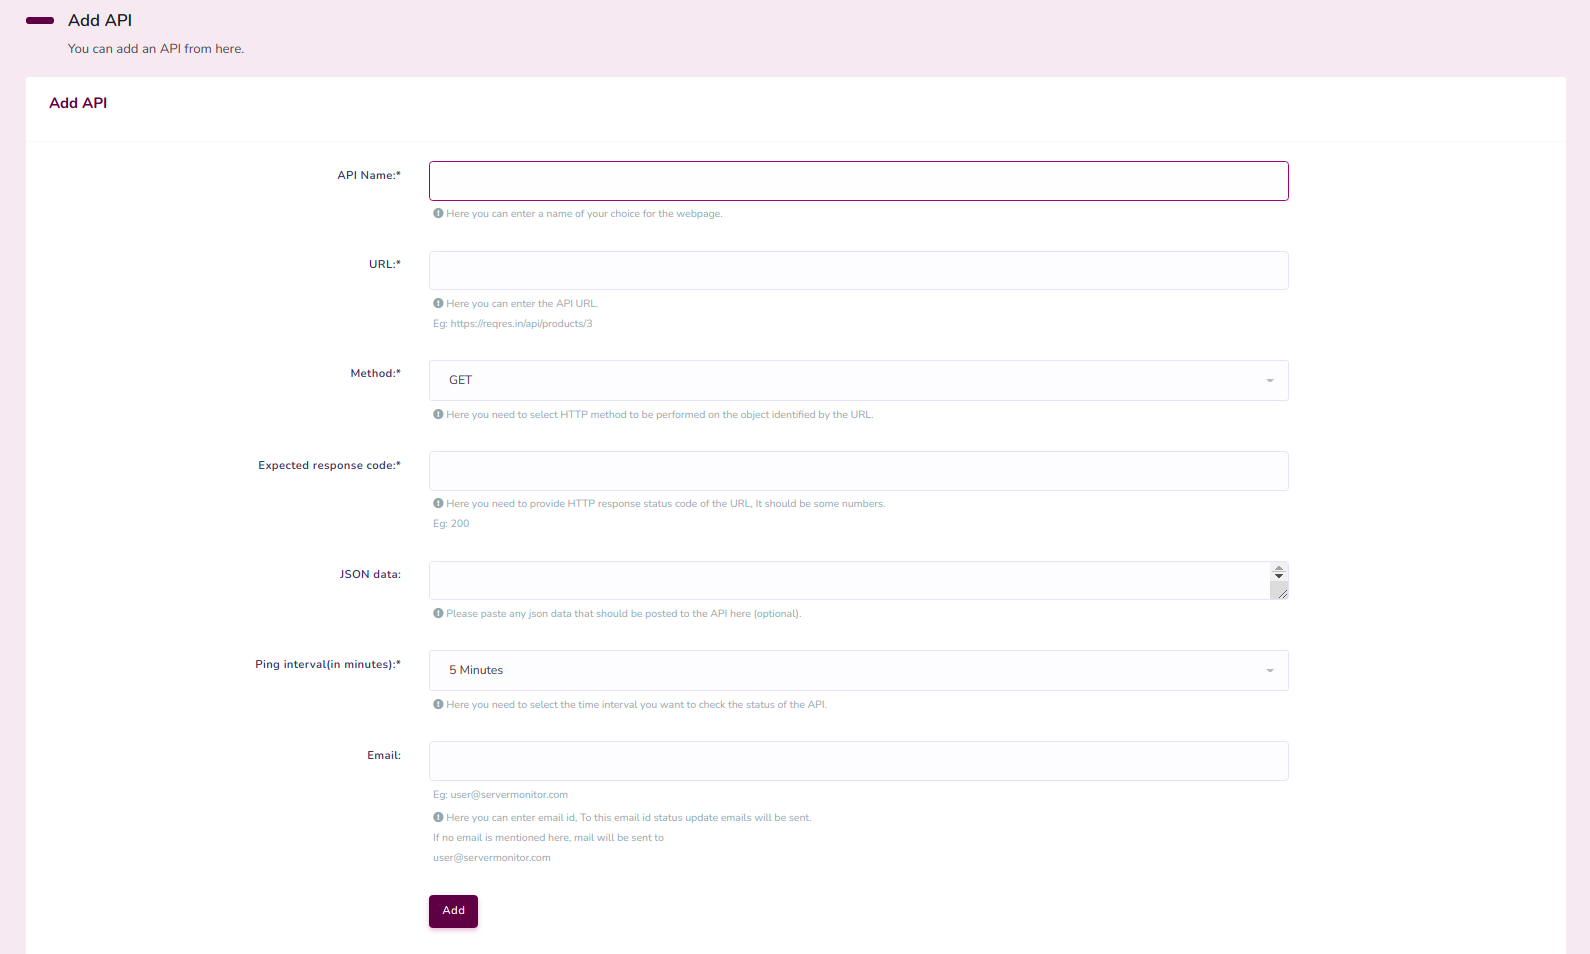
6.1 Add an API
Add API page:
Fig.6.2 Add API page
User can add an API by clicking "Add API" link given in the APIs page.
User have to provide a name for the API, URL of the API, Expected HTTP response status
code of the URL, HTTP method to be performed on the object identified by the URL (GET,
POST, PUT or DELETE), ping interval(status check interval), and
an API email(optional).
User can provide an email address to receive the API status updates. If no email is
mentioned, the mail will be sent to the user's email address.
If an API is down at the time of adding (if the details given are incorrect or if the
API is really down), a warning message will appear at the top. If you still need to add,
you
can check the checkbox appeared at the bottom and click the add button again.
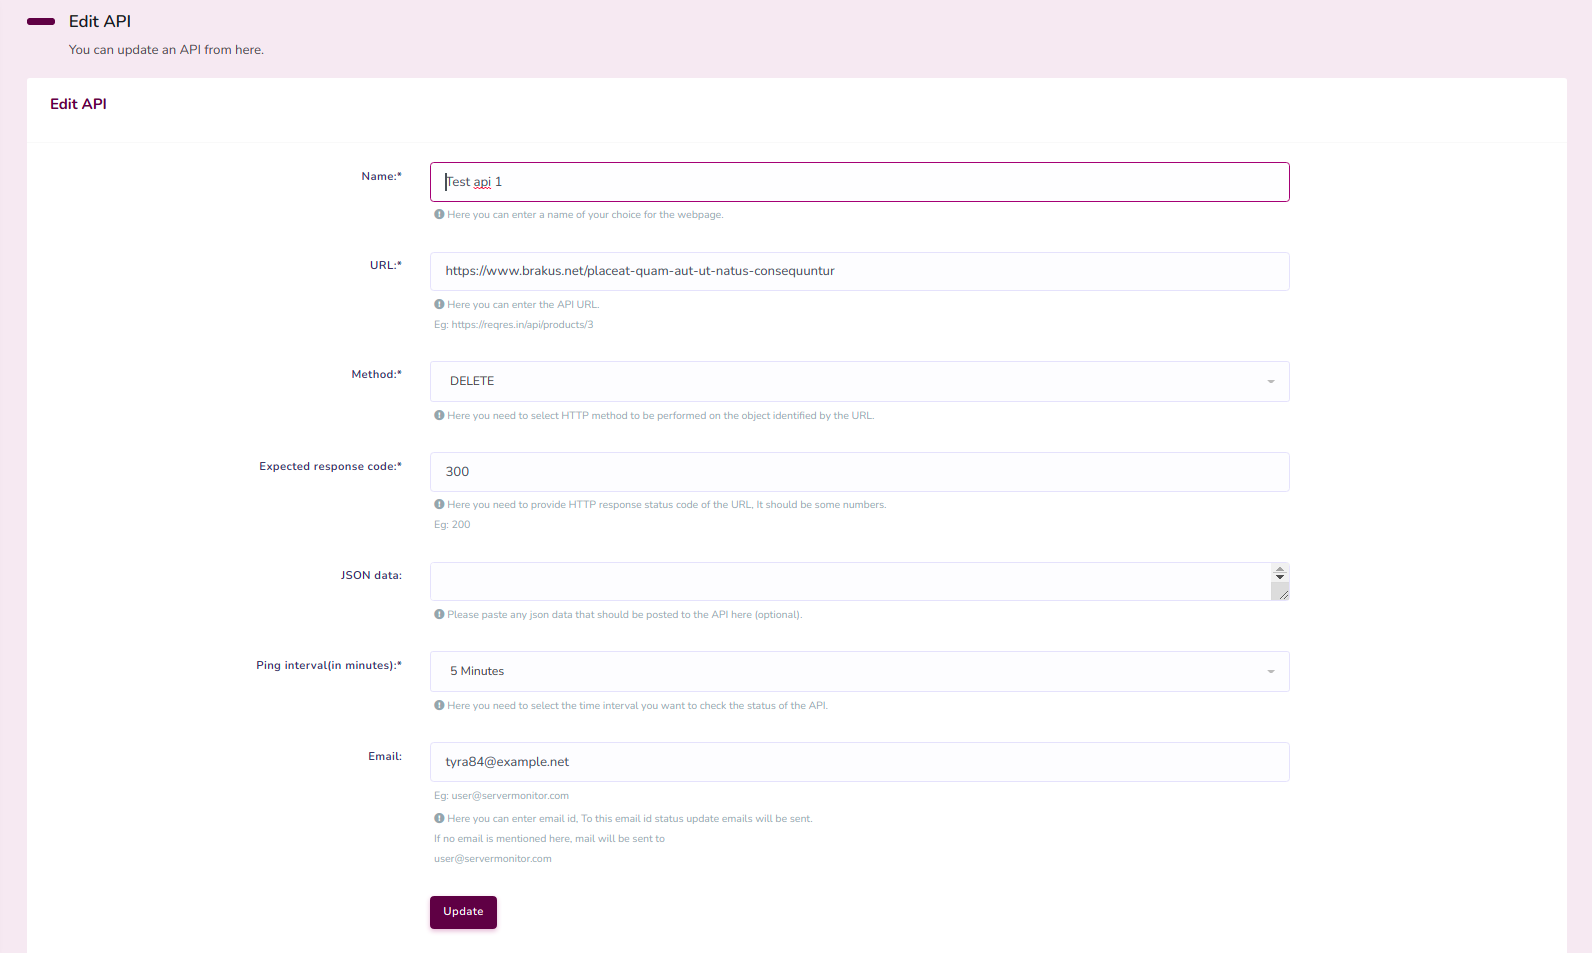
6.2 Update an API
Update API page:
Fig.6.3 Update API page
User can update an API by clicking edit link given in the APIs page.
User have to provide the updated details as done at the time of adding API.
As in the case of add API, if the API is down at the time of updating (if the details
given are incorrect or if the API is really down), a warning message will appear at the
top. If you still need to update, you can check the checkbox appeared at the bottom and
click the update button again.
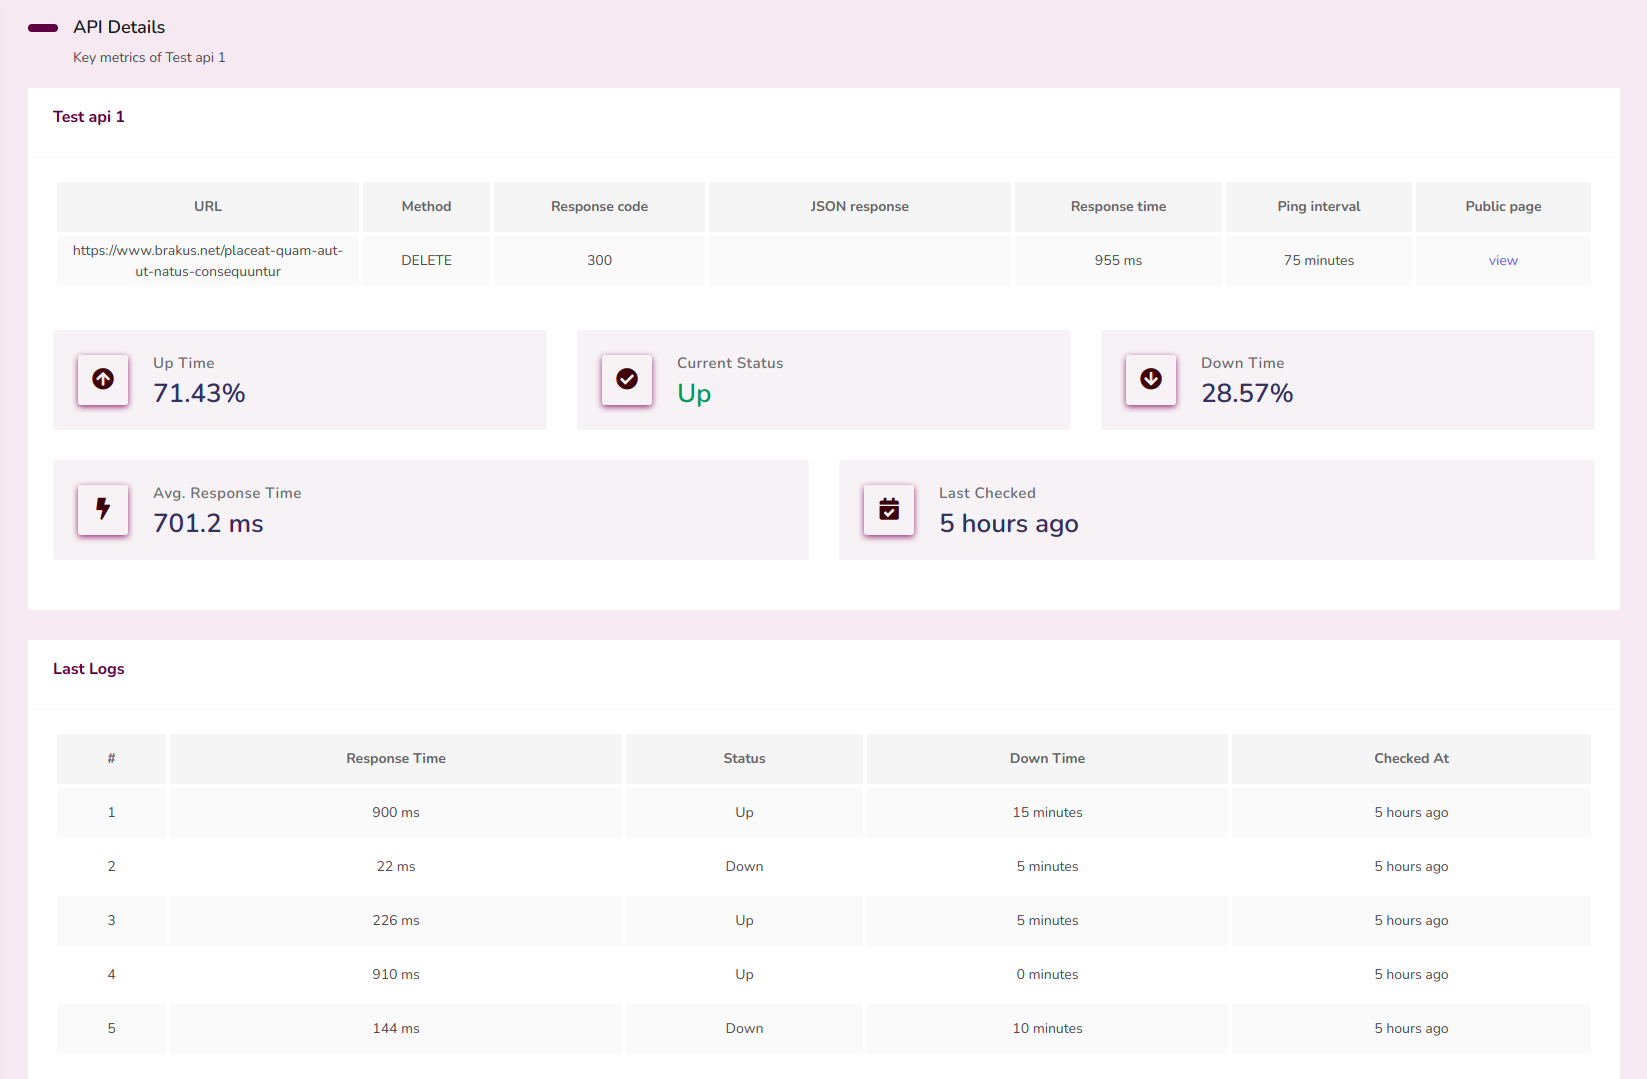
6.3 View Api Details
API details page:
Fig.6.4 API details page
To get an API's detailed information, click on the view link from APIs section.
User can get up time and down time percentage, current status, avg response time, Last
checked time and last five logs of checking status from this page.
User can also access the public page from this page.
7. Public Pages
A public status page is a specialized monitoring dashboard designed to publicly showcase
the availability status of a server, webpage, or API being monitored. Here you can add
and show the public page of a server, Webpage or API and separate links for each types
are provided. User can access these from public pages section in the panel.
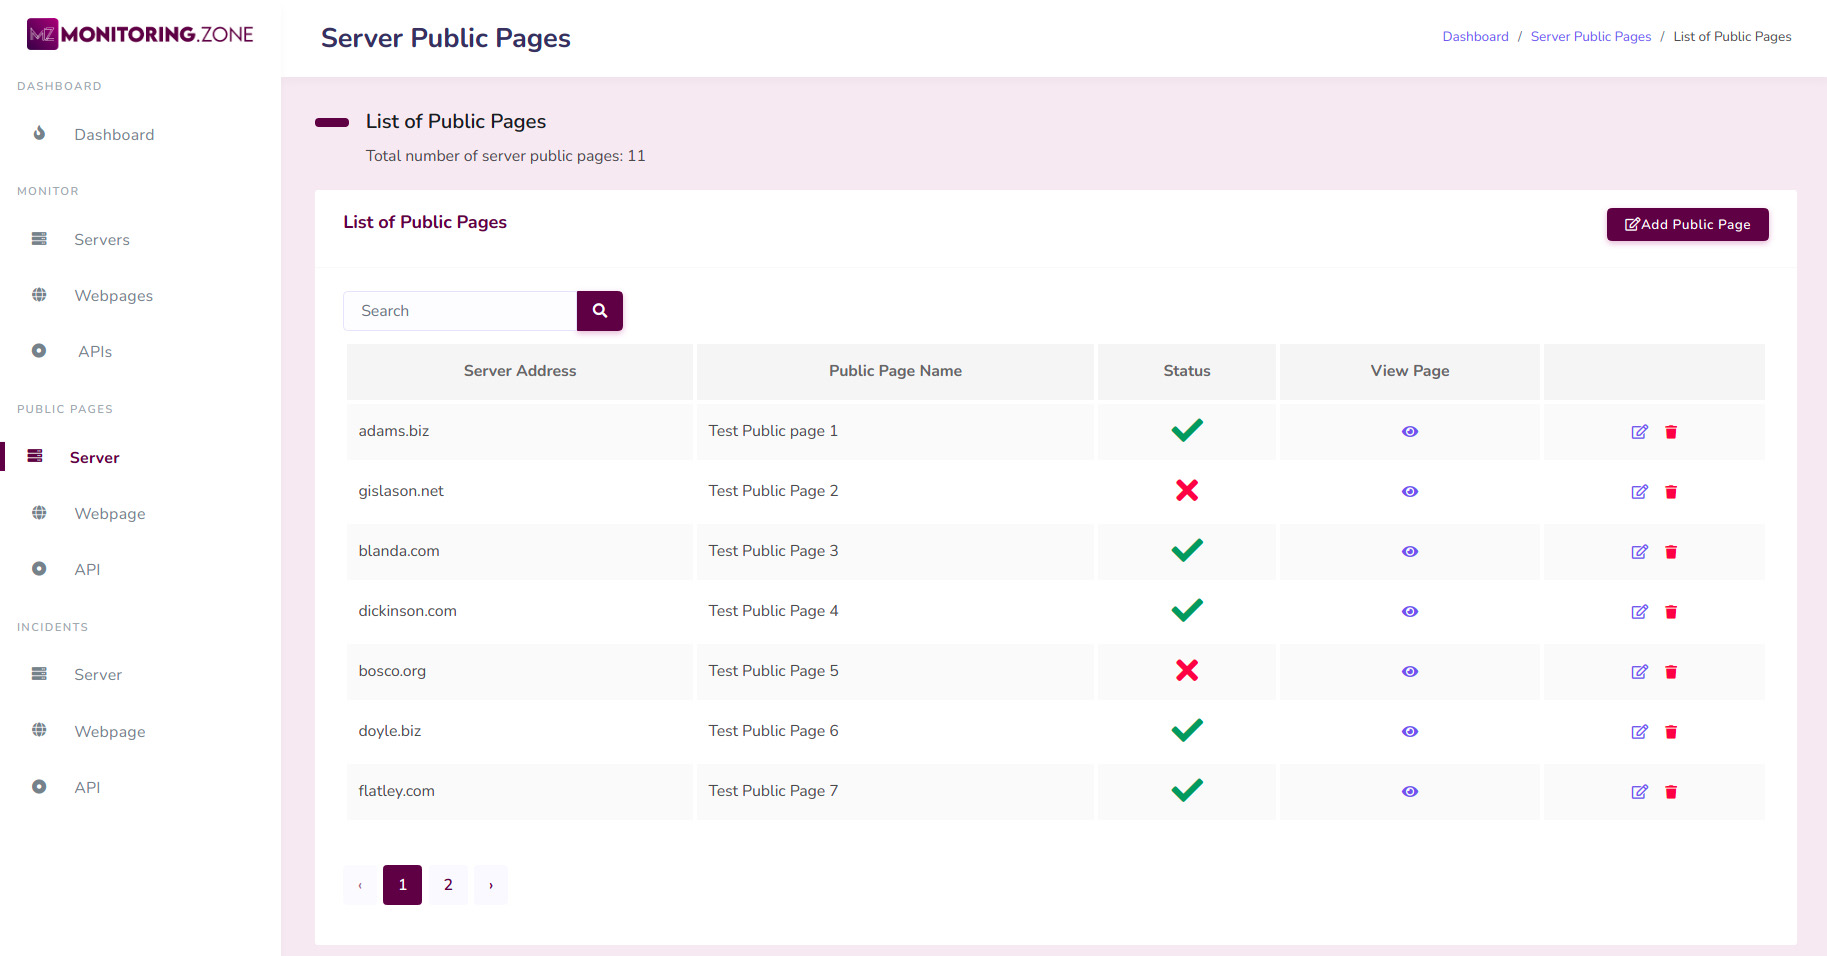
List of Public Pages:
Fig.7.1 List of Public Pages
The picture shown above is the listing of public pages. The basic information like
name or address of the monitor type (Server, Webpage or Api), name of the public
page etc. is given here.
The green tick and red cross indicates the active and inactive states of the public
page respectively.
There are some links in this page also to add, view, update and deleting of a public
page.
User can filter public pages by searching with monitor name (address in the case of
servers), public page name and related keywords.
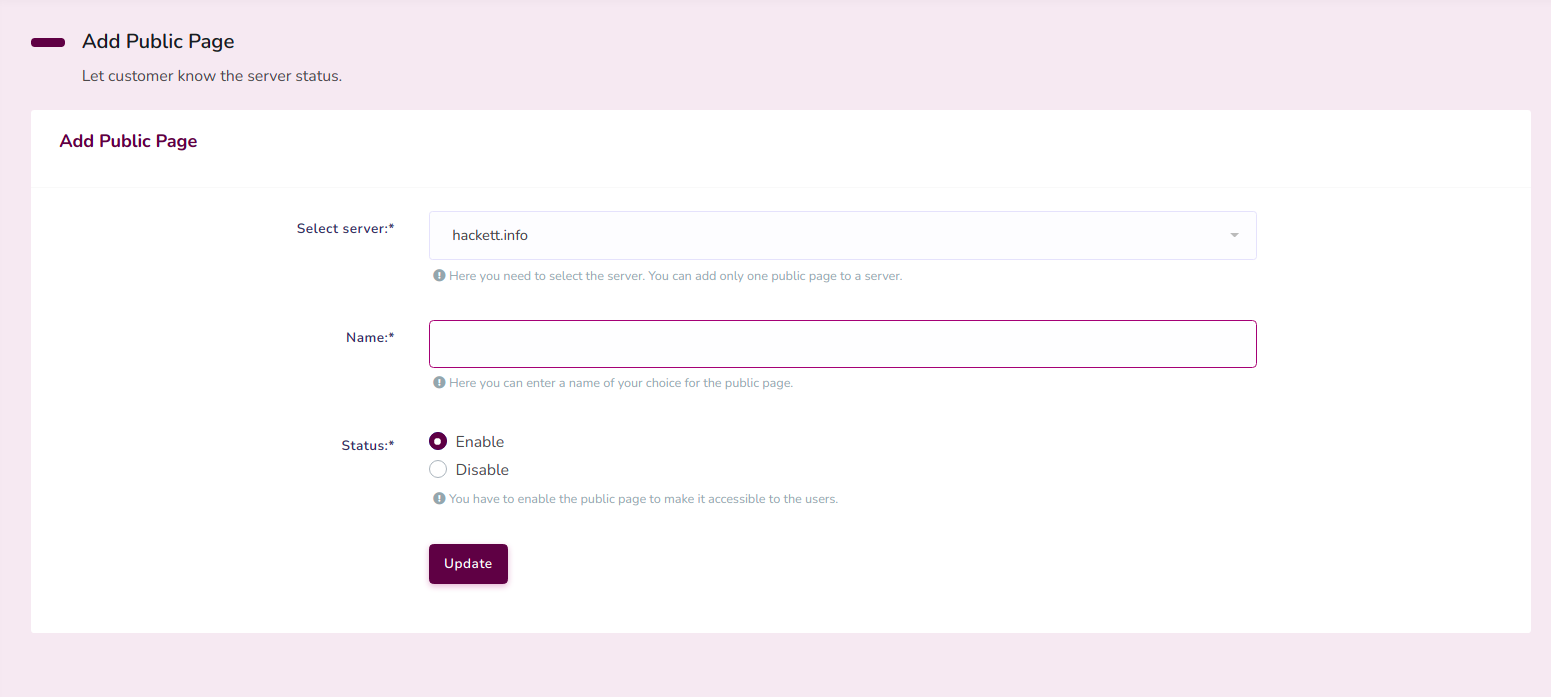
7.1 Add a Public Page
Add public page panel:
Fig.7.2 Add public page panel
User can add public page by clicking "Add Public Page" link given in the public pages
section.
There must be at least one data in monitor section to add a public page.
User have to select the server/webpage/Api (Note that each type have separate links) and
have to provide a name for the public page. Note that no two public pages can have the
same name
It is mandatory to enable the public page in order to show it to the public.
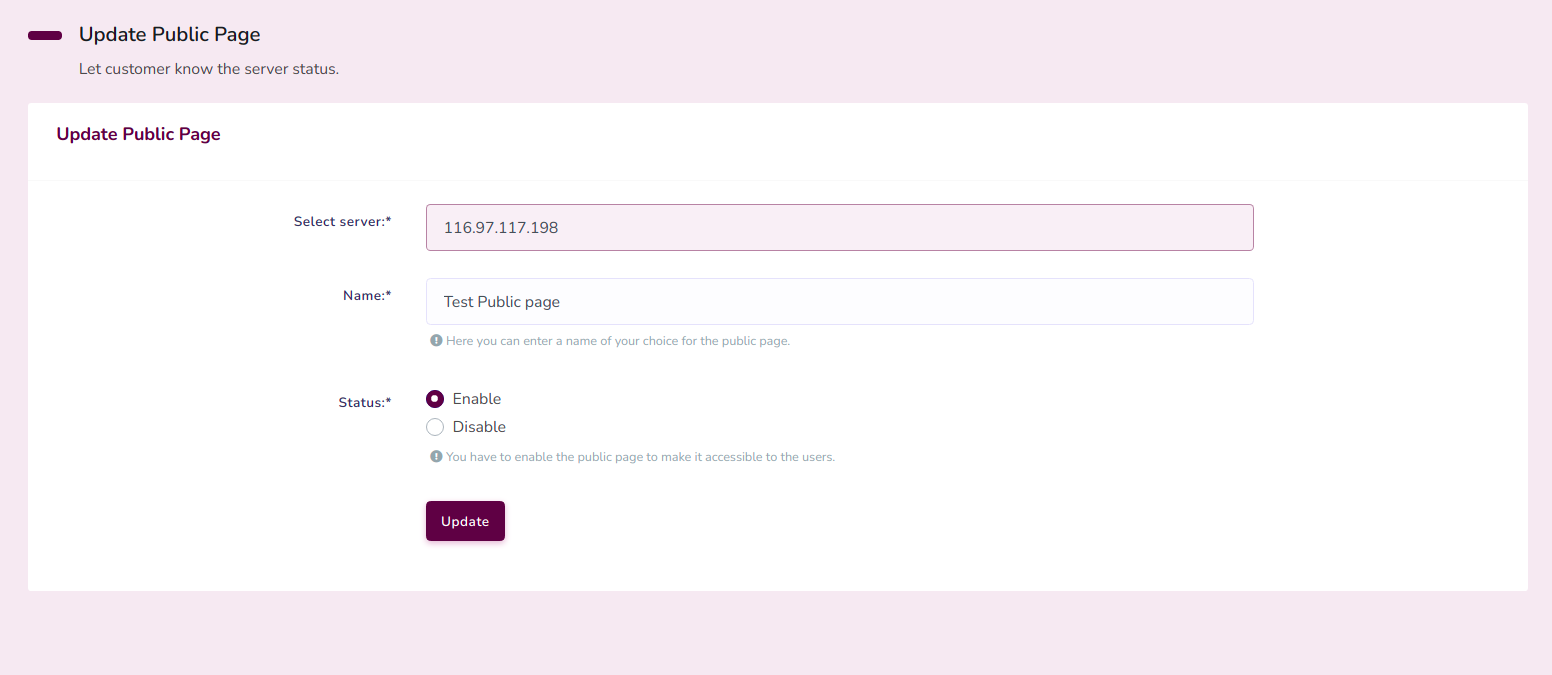
7.2 Update a Public Page
Update public page panel:
Fig.7.3 Update public page panel
User can update a public page by clicking edit link given to them.
User have to provide the updated details as done at the time of adding public page.
From there, you can also enable or disable the public page.
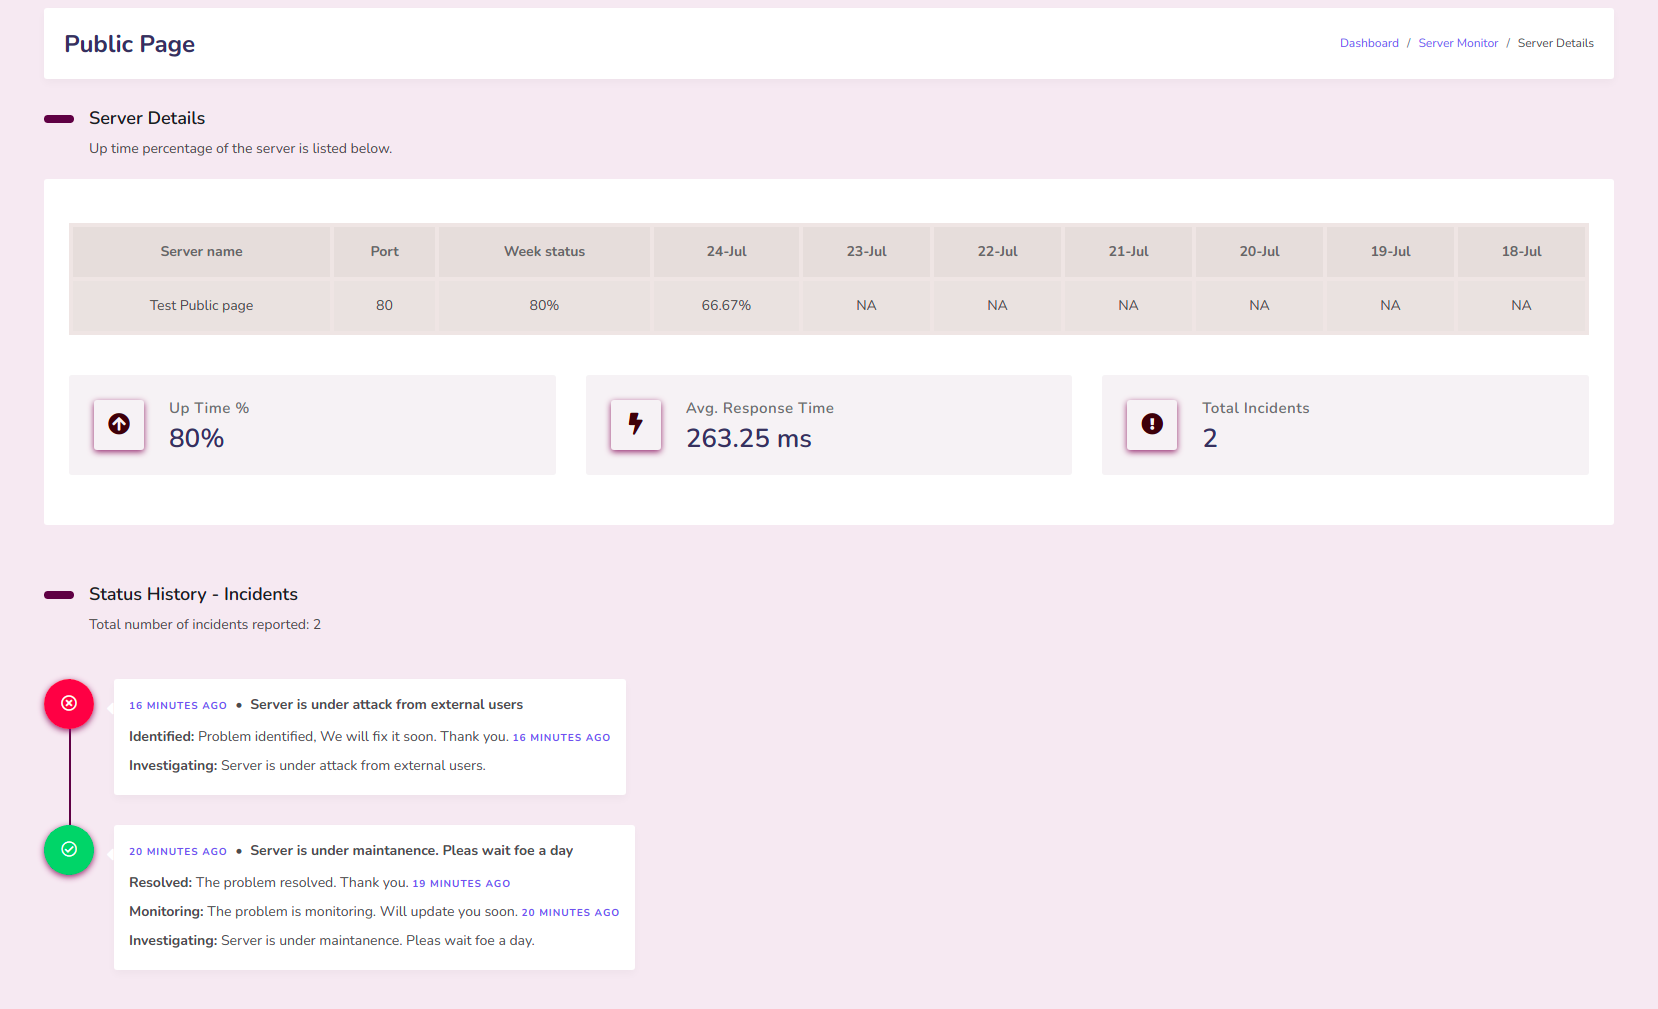
7.3 Public Page Details
Details of public page:
Fig.7.4 Details of public page
User can see your public page data from both public page section and monitor section.
There is a link provided in both cases to view the public pages.
User must provide the link of each public pages in order to show it to the public.
A lot of details are given in this page like:
Up time percentage of the last 7 days (day wise and total).
All time up time percentage.
Average response Time.
Total number of incidents.
Also the incidents and it's updates (Refer section 9 for more details).
8. Incidents
Incidents are the unintended event that disturbs normal operations. If there is an issue
in your server, webpage or API, you can add it to inform your users or public.
There are separate links to add incidents for each monitor types (server, webpage or
API). User can access these from the incidents section in the panel.
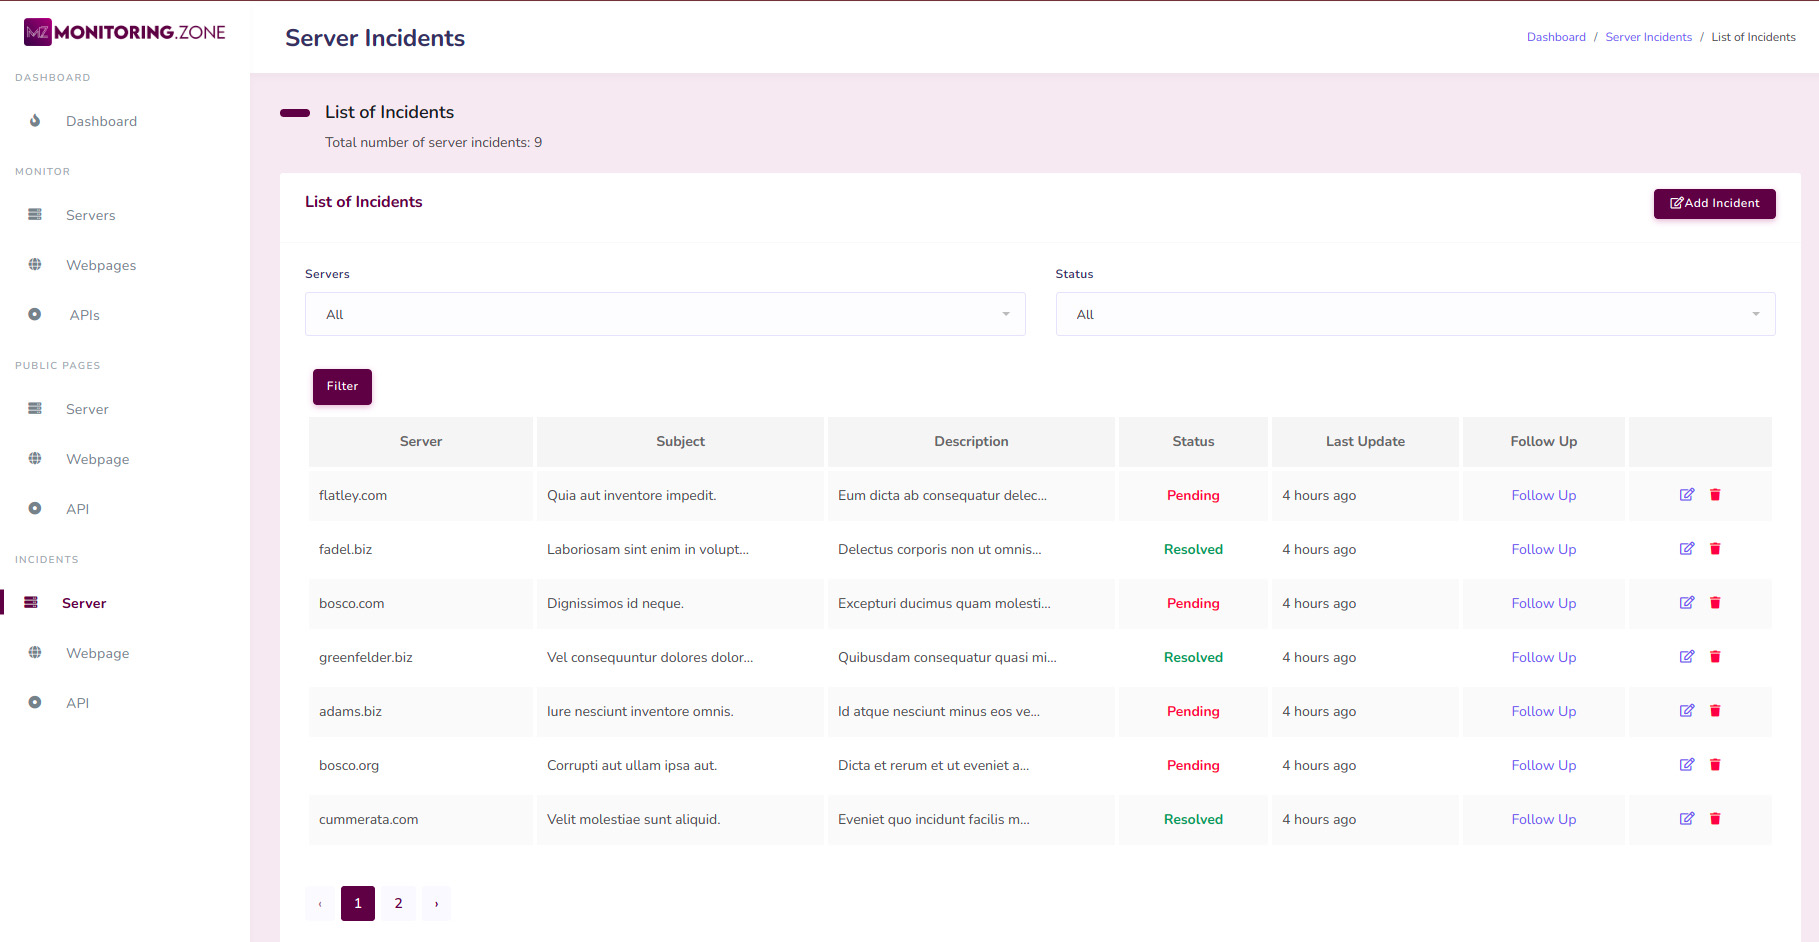
List of Incidents:
Fig.8.1 List of Incidents
The picture shown above is the listing of incidents. The basic
information
like name or address of the monitor type (Server, Webpage or Api) and subject and
description of the incident associated with it, status of the incident et. is given
here.
There are some links in this page also to add, view, update and deleting the
incident.
User can filter incidents by monitor name (address in the case of servers) and
status
(pending or resolved).
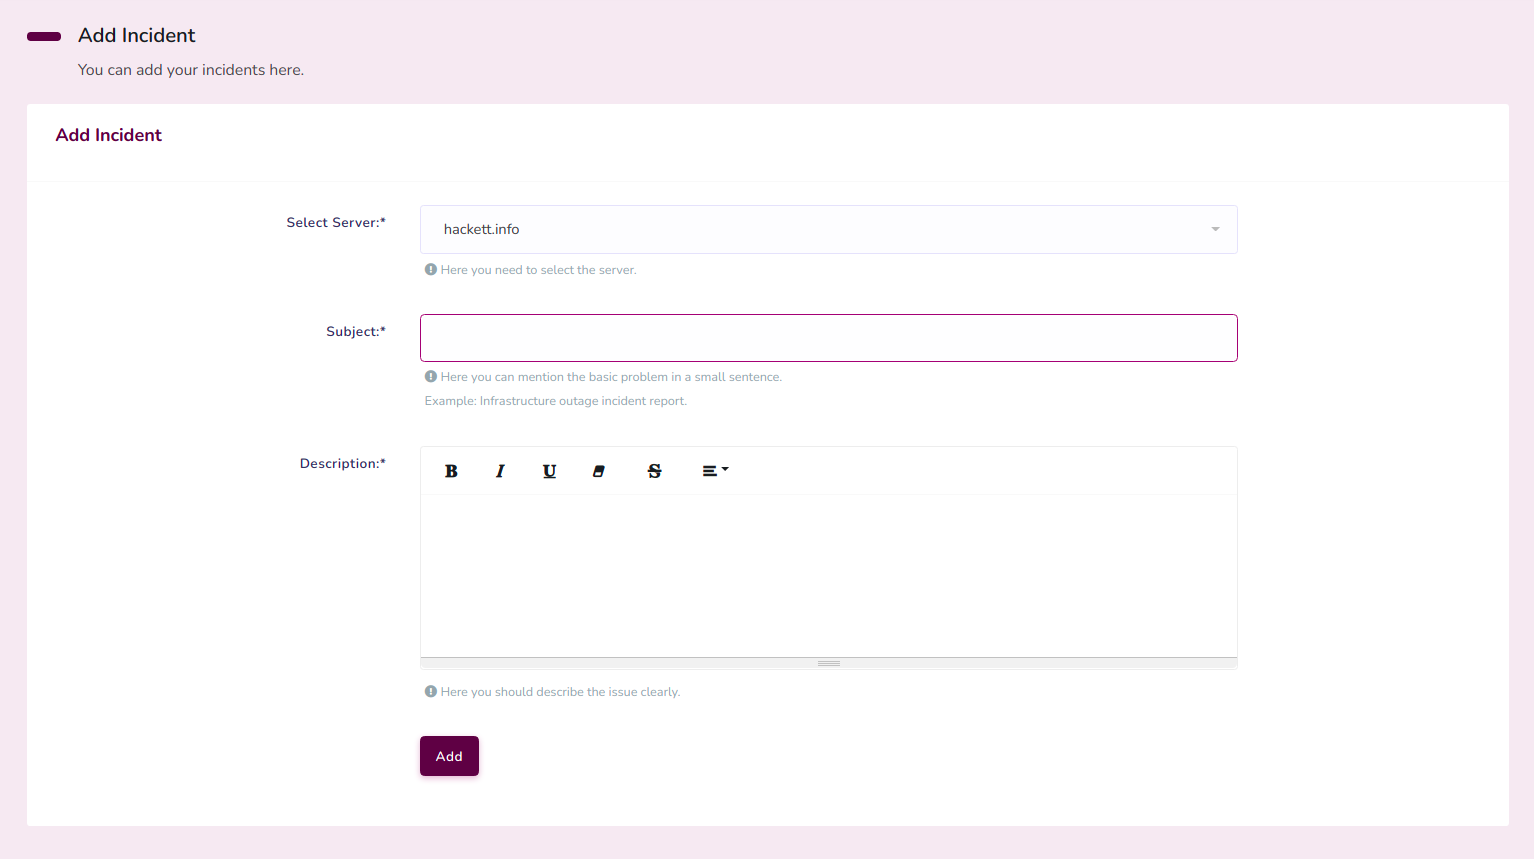
8.1 Add an Incident
Add incident page:
Fig.8.2 Add incident page
User can add an incident by clicking "Add Incident" link given in the incidents section.
User have to select the server/webpage/Api first(Note that each type have separate
links).
Also the subject and the detailed description should be given in the corresponding
fields.
After an incident is added, the status of the incident will be "Pending".
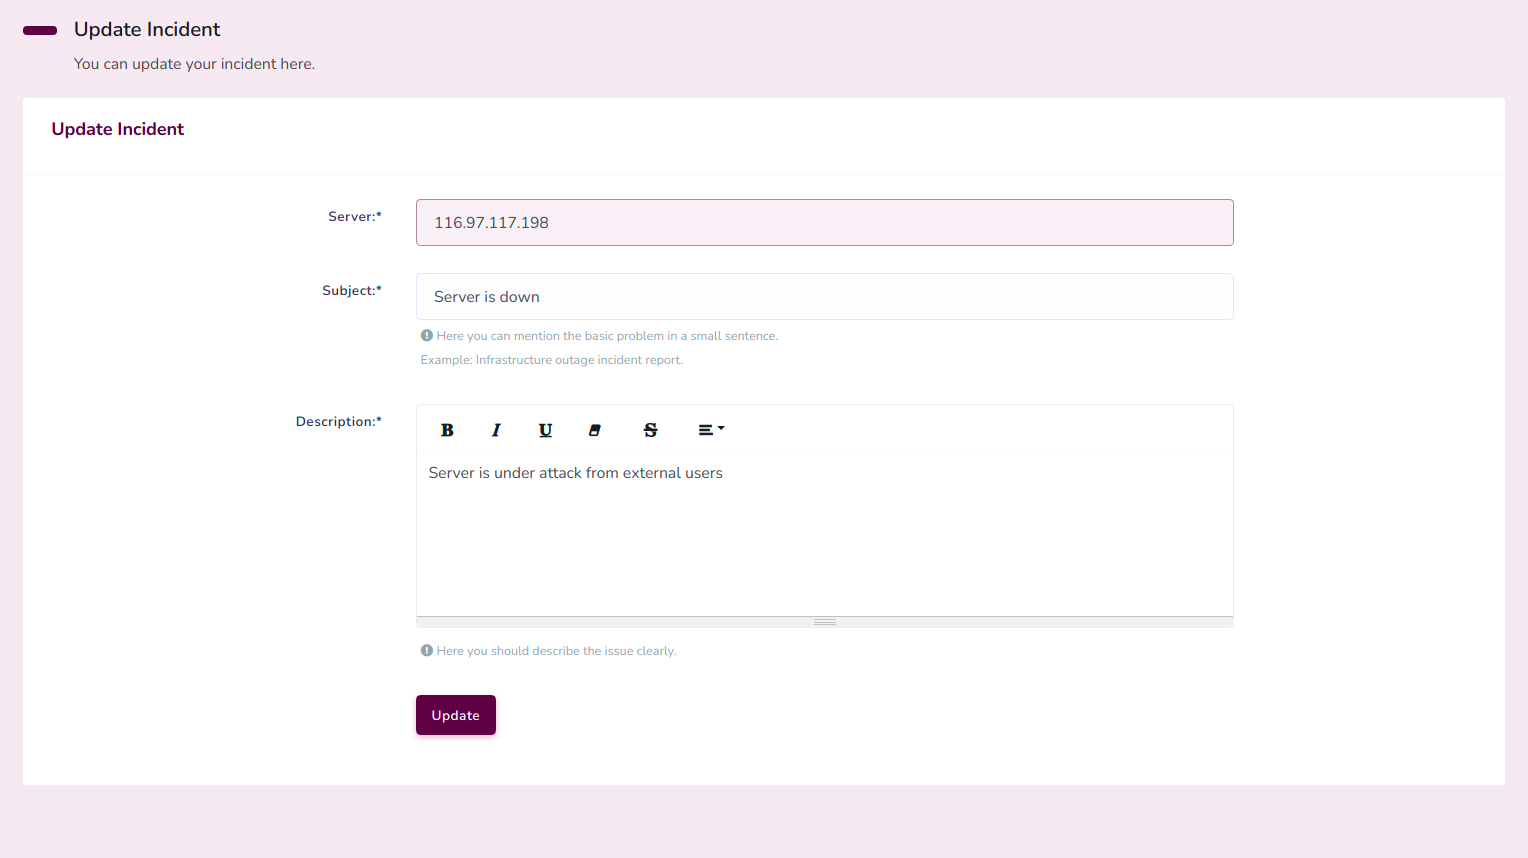
8.2 Update an Incident
Update incident page:
Fig.8.3 Update incident page
User can update an incident by clicking edit link given to them.
User have to provide the updated subject and description as done at the time of adding
incident.
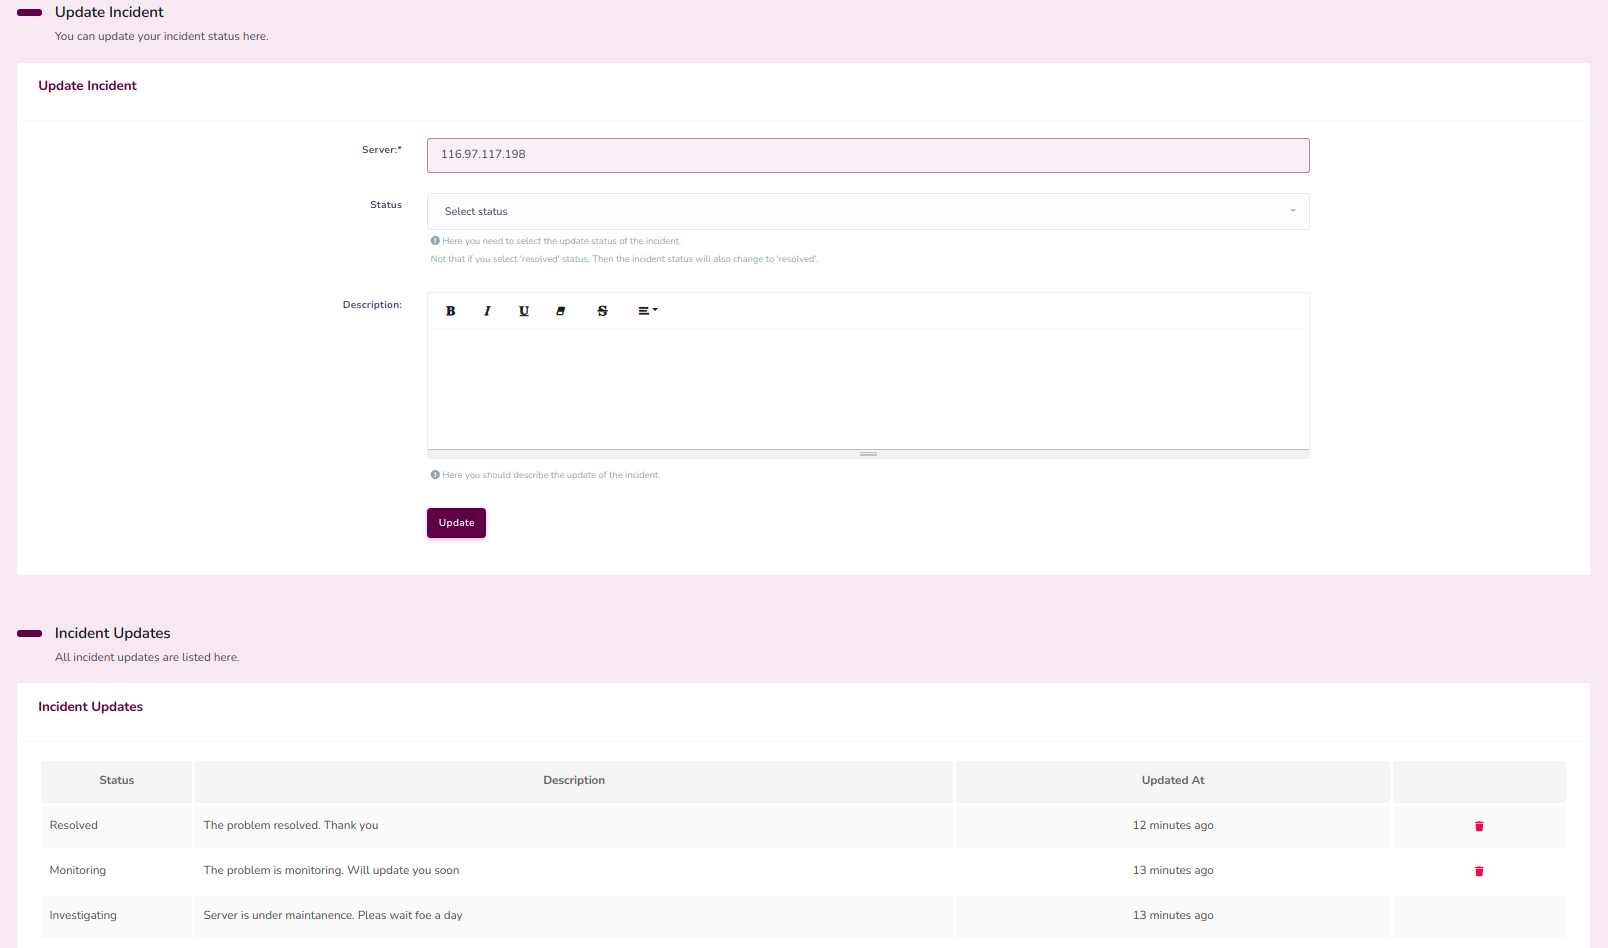
8.3 Update Incident Details
Incident follow up page:
Fig.8.4 Incident follow up page
After adding an incident, a user can add updates of the incident by clicking on follow
up link given for each incidents.
User should select a status (Monitoring, Identified, update and Resolved) and add the
description of the status.
If the selected incident details status is "resolved", The status of the incident will
also change to "Resolved".
Previous updates and details of the selected incident is also listed in this page
.
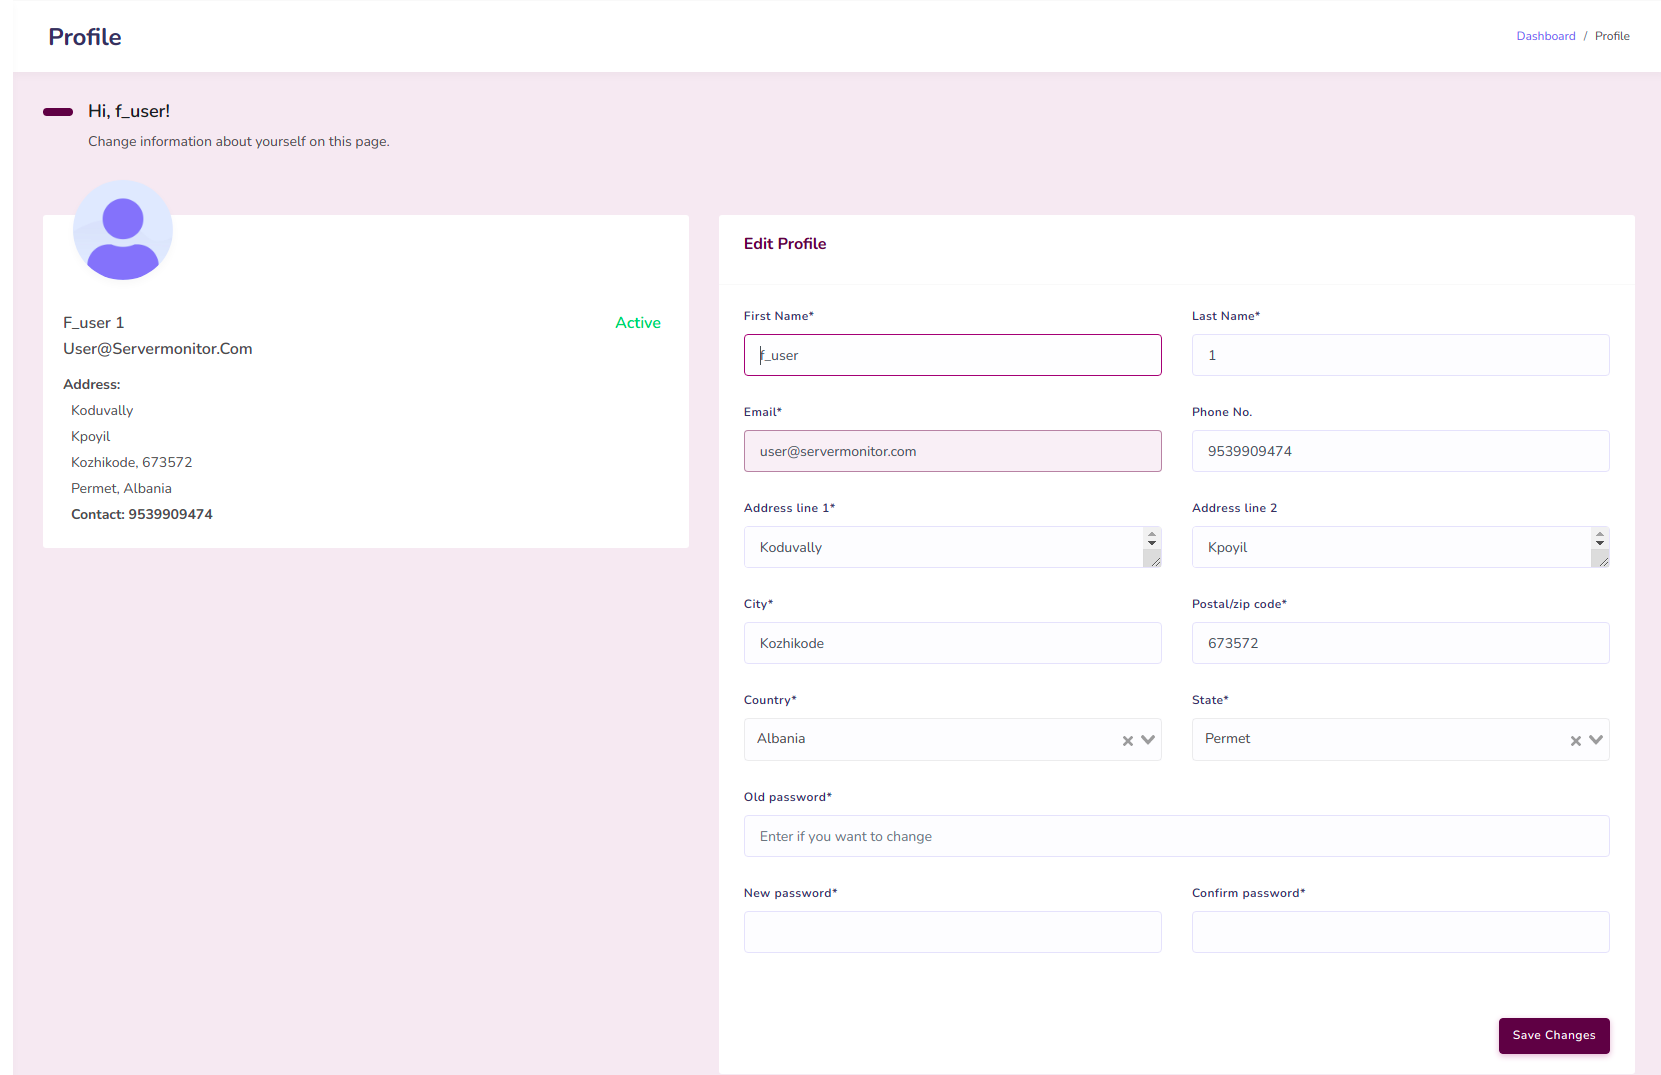
9. Profile
User profile:
Fig.9.1 User profile
User can view or update their profile from the profile section. They can update their
user details, address and login password from there.